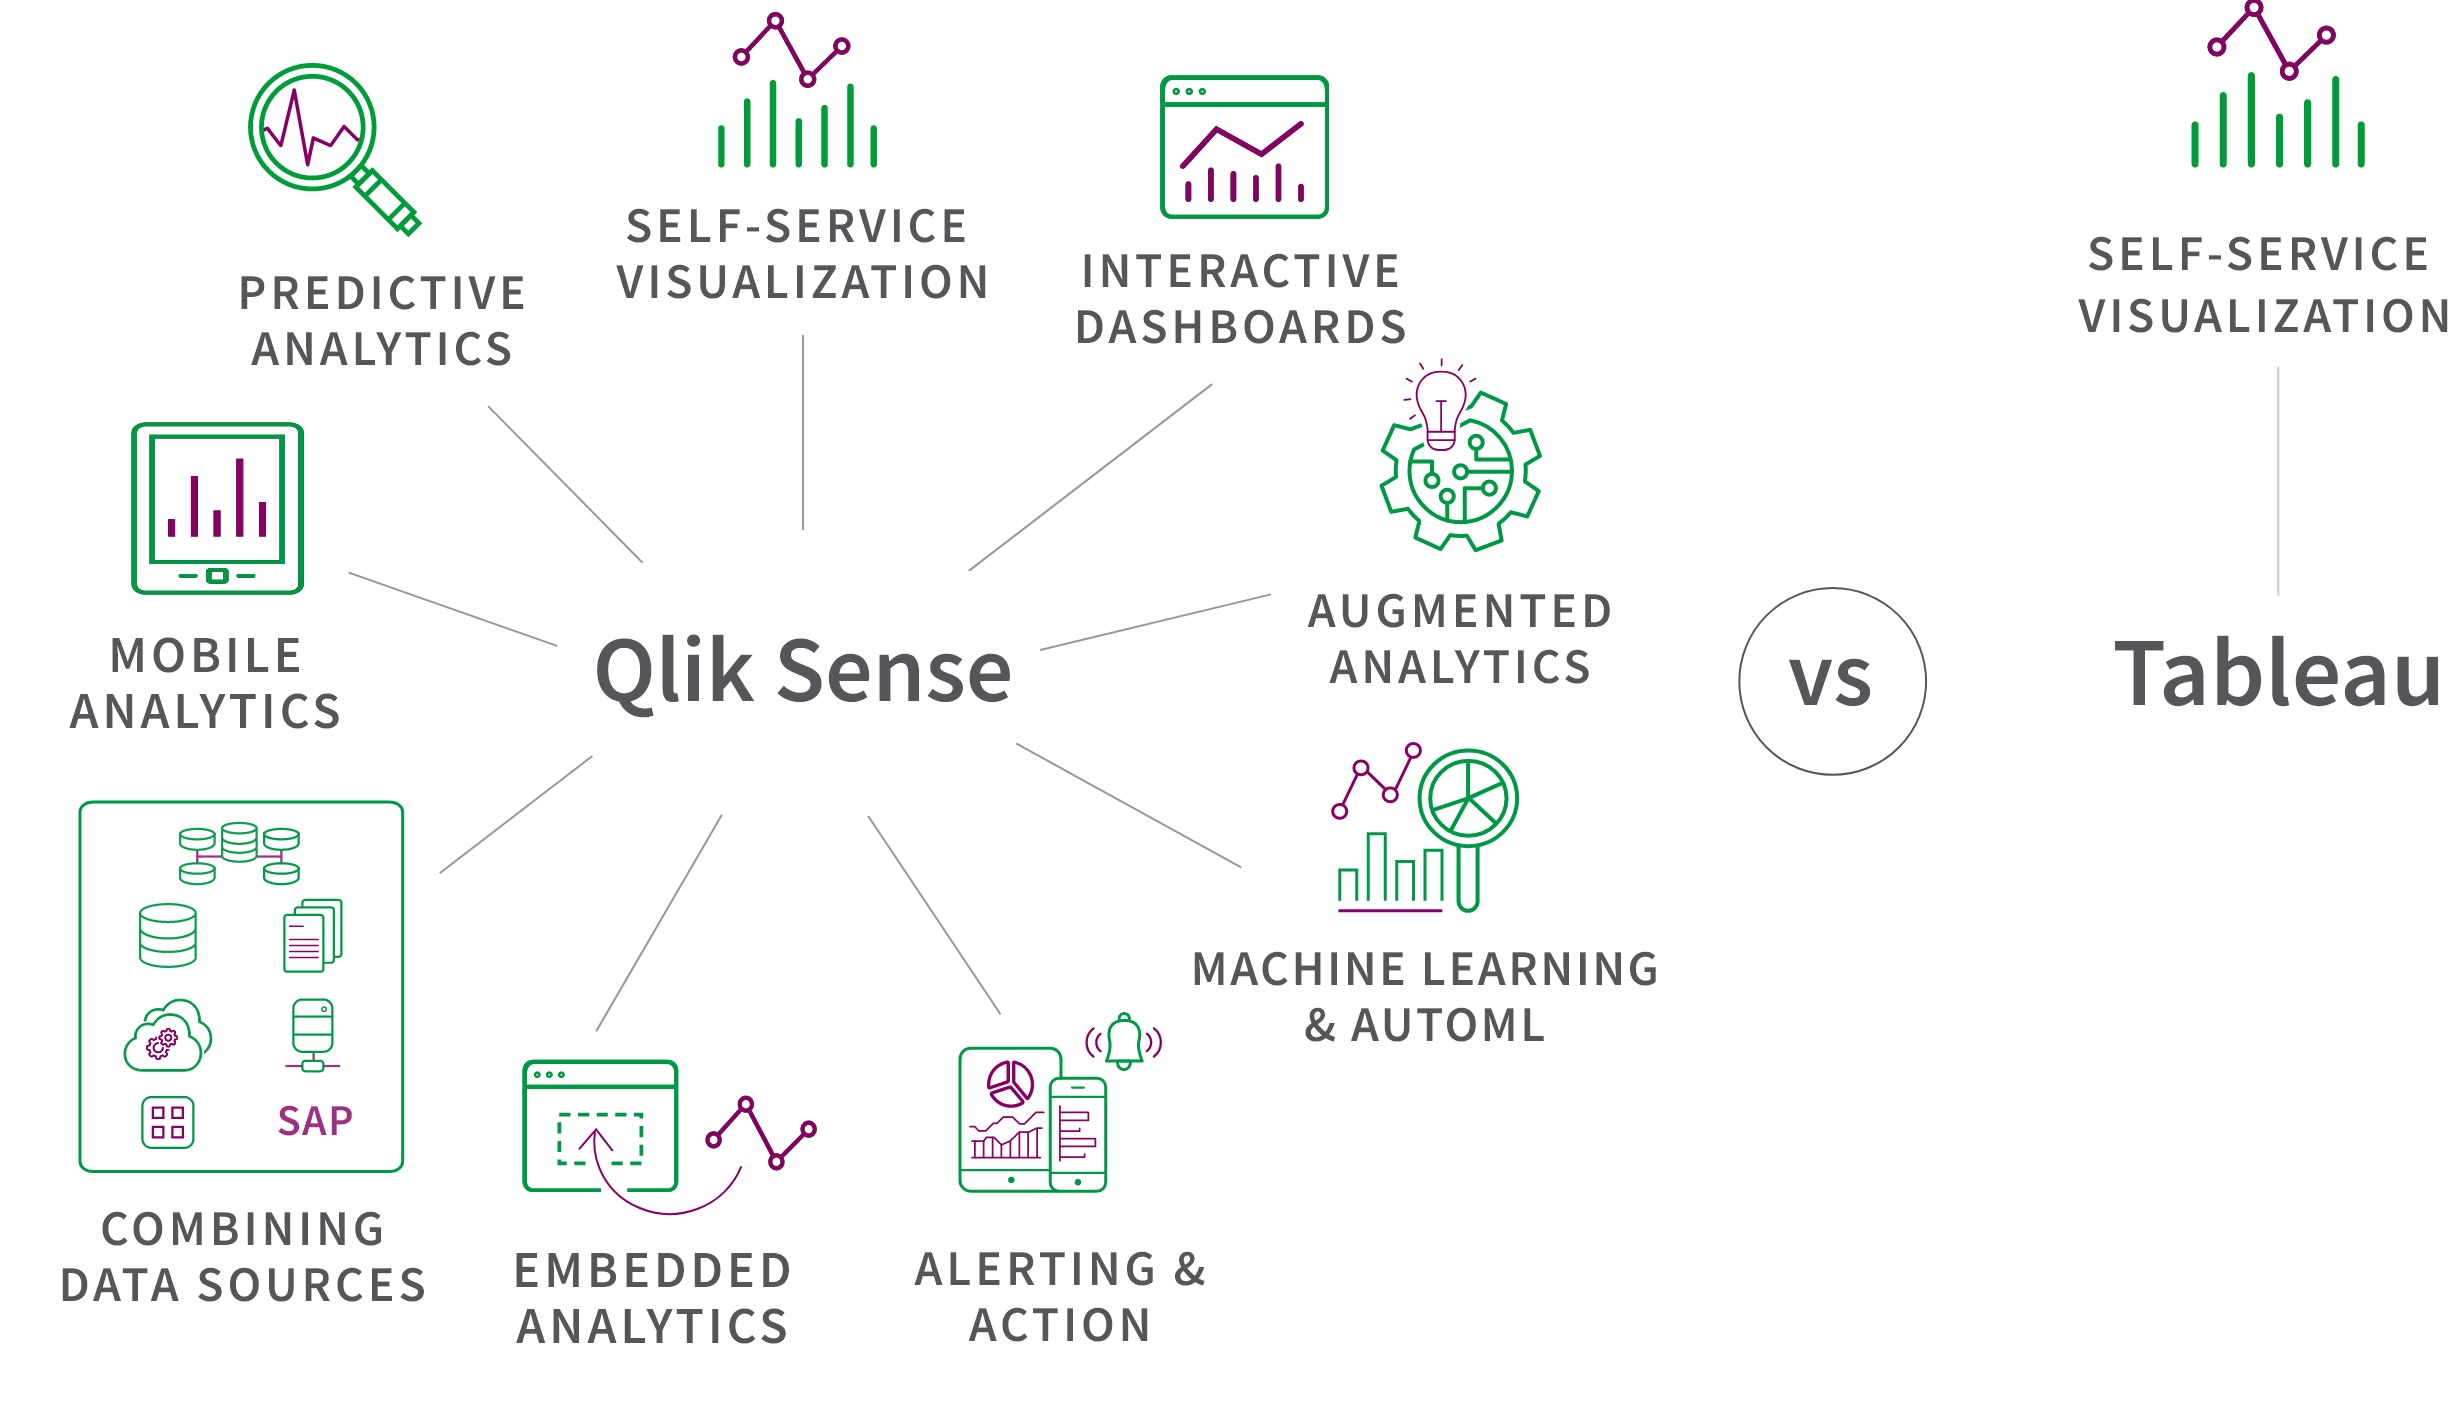
Qlik Sense
Qlik’s total cost of ownership is lower than Tableau. And Qlik has no additional or hidden costs as you scale.
Tableau
Tableau requires additional investments in software and infrastructure as you scale.
“The price comparison is very misleading.”
- Tomasz Wojcik, Thermoplast, Qlik User Survey
Qlik Sense
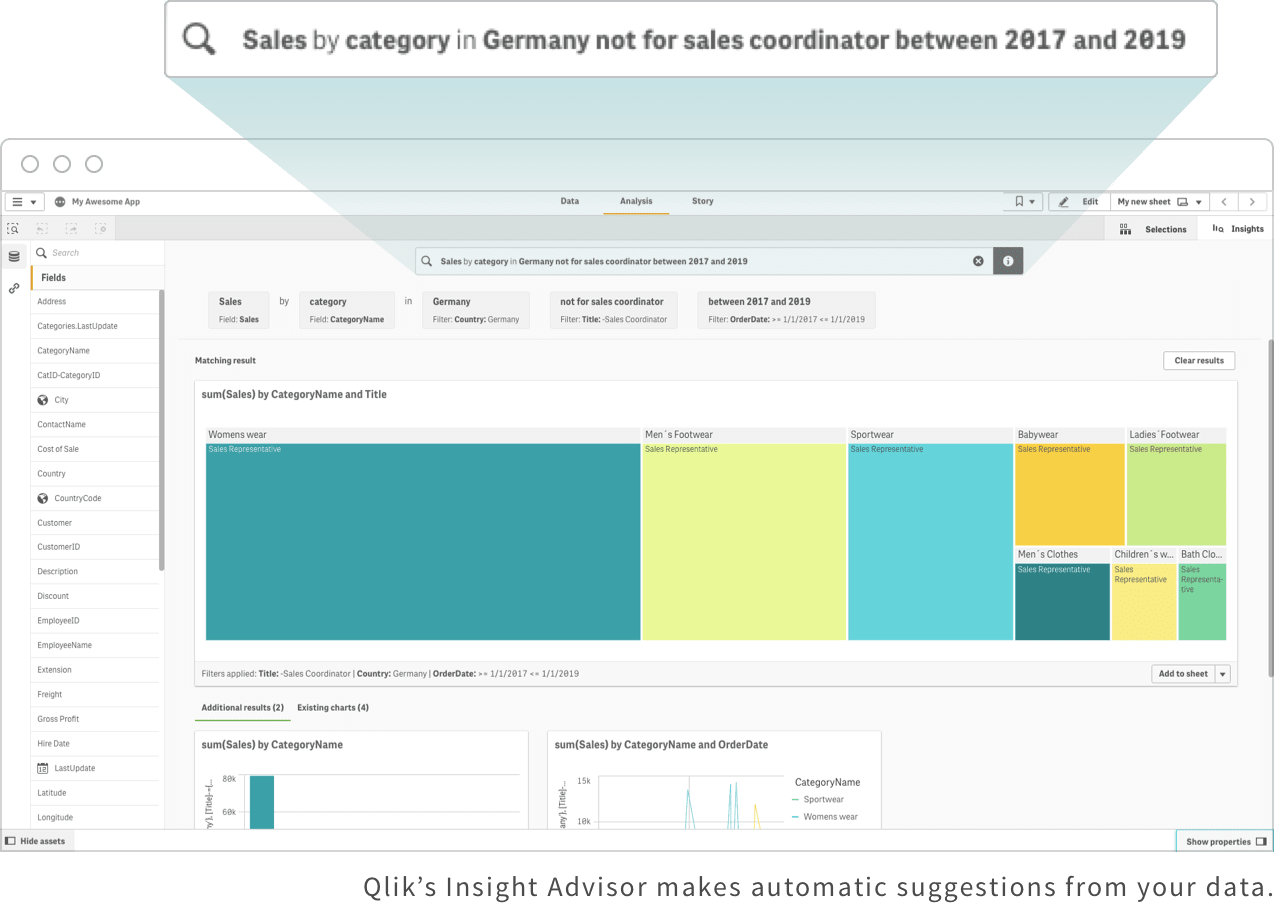
With AI and ML integrated into its platform at a foundational level, Qlik supports a full range of augmented analytics capabilities. This includes automated insight generation, natural language analytics, and authoring assistance. Together these capabilities offer deeper insight, help more people become data literate, and speed time to value.
Tableau
While it includes narratives, Tableau lacks a true form of automated insights. Tableau’s NLQ, called Ask Data, can produce a simple answer to questions users ask. But it only supports English and works with a data source, not with the business logic built into workbooks, so it can’t leverage the insights your analysts have built.
“Conversational analytics in Qlik Sense allows us to give the intelligence that people in the field need right where and when they need it.”
- Pavan Arora, Upshot by Influitive Interviews
Qlik Sense
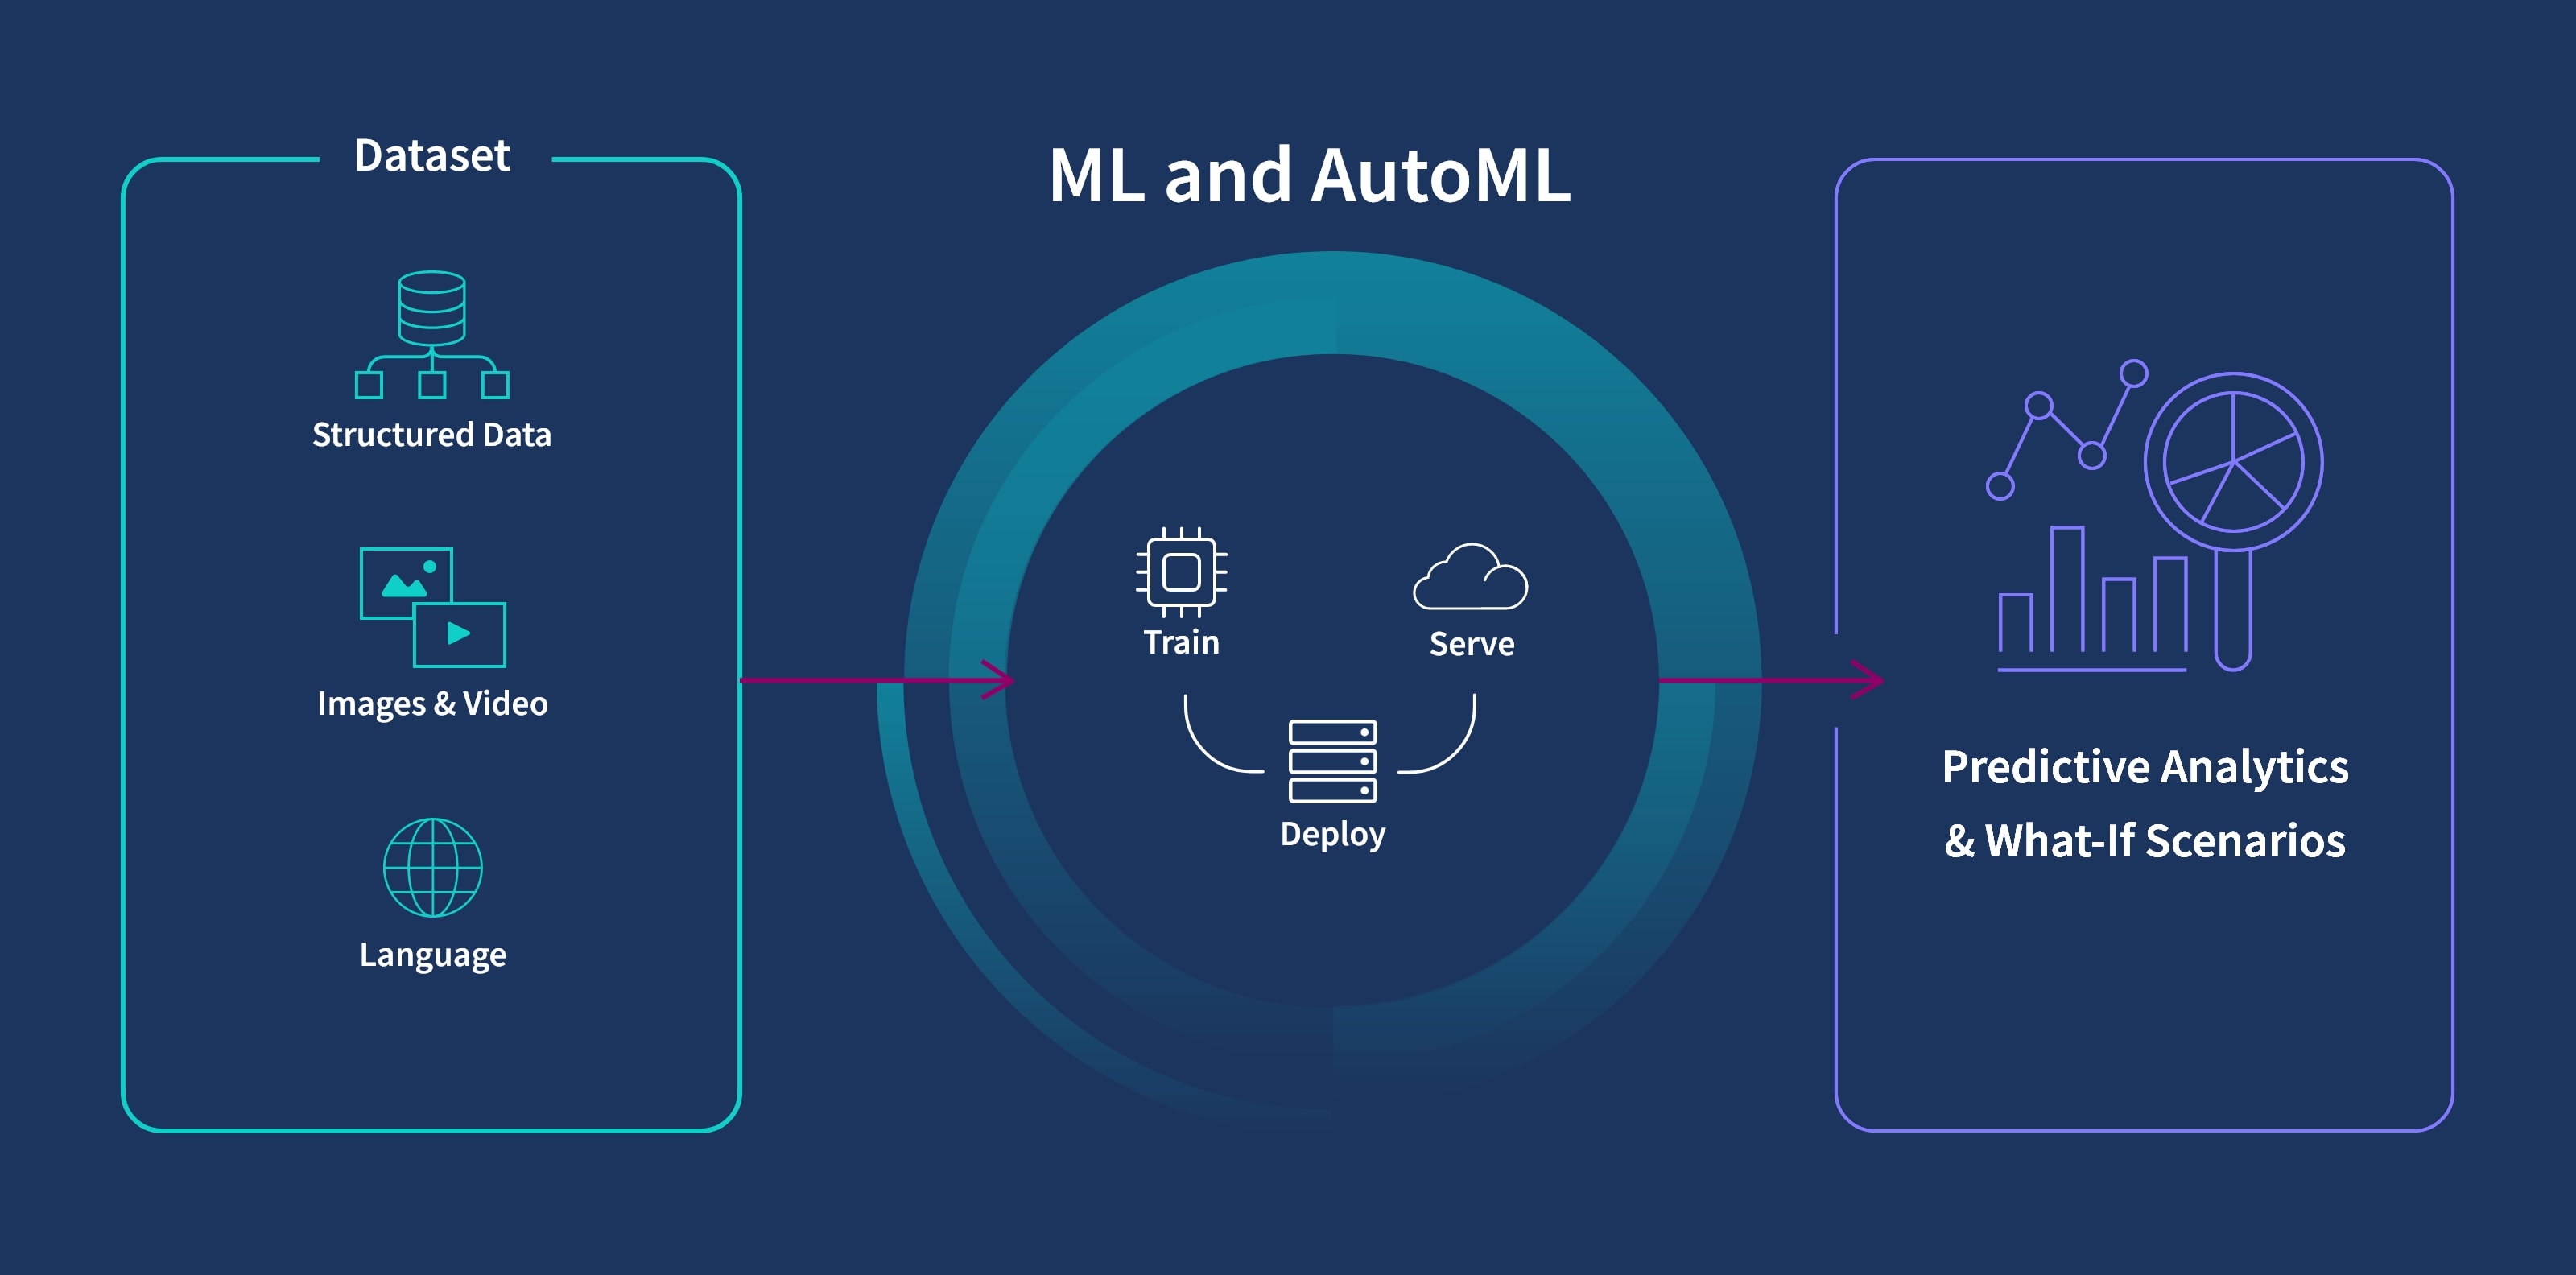
Qlik AutoML allows analytics users to easily create ML models and generate predictive analytics, helping you move from historical analysis to predictive and prescriptive. With full explainability, you can understand not just what might happen but why, so you can take action. And you can do this as an analytics user without having to be a data scientist.
Tableau
Salesforce offers Einstein Discovery which provides key driver analysis but lacks true predictive capabilities. Einstein doesn’t scale given its very small data limits. Furthermore, it’s a separate cloud, not part of the Tableau experience, and only works on Salesforce data. So you wouldn’t be able to analyze your HR, Finance, or other separate data.
“We were stumbling blind, trying to figure out what would stop churn and it was frustrating trying to find something that would move the needle. Now, machine learning has really given us direct clarity as to what will make a difference. Instead of guessing, we now know what will bring results.”
- Ben Dean, Upshot by Influitive Interviews
Qlik Sense
Users of all skill levels across your business can engage in the best way for them, from data exploration to real-time analytics, to natural language interaction, on the same platform with a common analytics data pipeline, analytics engine and AI capabilities.
Tableau
Tableau is primarily a self-service authoring tool for analysts to create data visualizations. While strong at styling content, it lacks the flexibility to allow users to explore independently and lacks the scalability and analytical sophistication to address more complex use cases.
“Not only has Qlik's partnership brought us where we are today, but it's been used for dozens of different use cases around our organization.”
- Jason Ferriggi, Upshot by Influitive Interviews
Qlik Sense
Qlik offers intelligent, fully data-driven alerting that is independent of any particular visualizations, delivered through email and mobile push notifications. And with application automation, you can orchestrate events and actions in all kinds of downstream systems and workflows.
Tableau
Tableau allows authors to monitor the value of a point on a chart, but it lacks the ability to create complex rules that would allow monitoring for data conditions. And without acquiring third party software, automations are limited to Salesforce Flow only.
"We believe the combination of self-alerting and mobility is responsible for the continual growth in our user base"
- Rob O'Neill, Upshot by Influitive Interviews
Qlik Sense
Qlik centralizes and unifies your data and analytics in the cloud, creating governed data models with robust data security. And all content creation happens in the cloud, where it’s governed and controlled at every step. Plus, governed libraries provide reuse and standardization for analytics.
Tableau
Tableau’s primary authoring environment is on the desktop, where governance is not possible. As a result, authors could create incorrect analytics without any oversight. In addition, to personalize content you must make copies, even for minor changes, creating duplication and complexity to manage.
“Not everyone is a data geek. Creating a simple-to-use application gives everyone—regardless of their comfort with data—the tools they need to better perform their job.”
- Michael Taylor. Upshot by Influitive Interviews
Qlik Sense
Qlik offers a fully-native mobile app with its analytics engine running locally and push alerting. With responsive design and touch interaction native to the Qlik platform, you get fully interactive online and offline exploration and integrated alerting without having to redesign apps for mobile access.
Tableau
Tableau isn’t responsive but does allow you to define layouts for mobile use. But they also recommend turning the feature off for better performance. For the user, Tableau only lets you download one sheet from a workbook to the mobile device. And you’re not able to filter; you’re only able to highlight one value at a time and scroll to find that value in related charts.
“Qlik is much more intuitive and offers way better mobile support than Tableau.”
-Ryan Hanson, Qlik User Survey
Qlik Sense
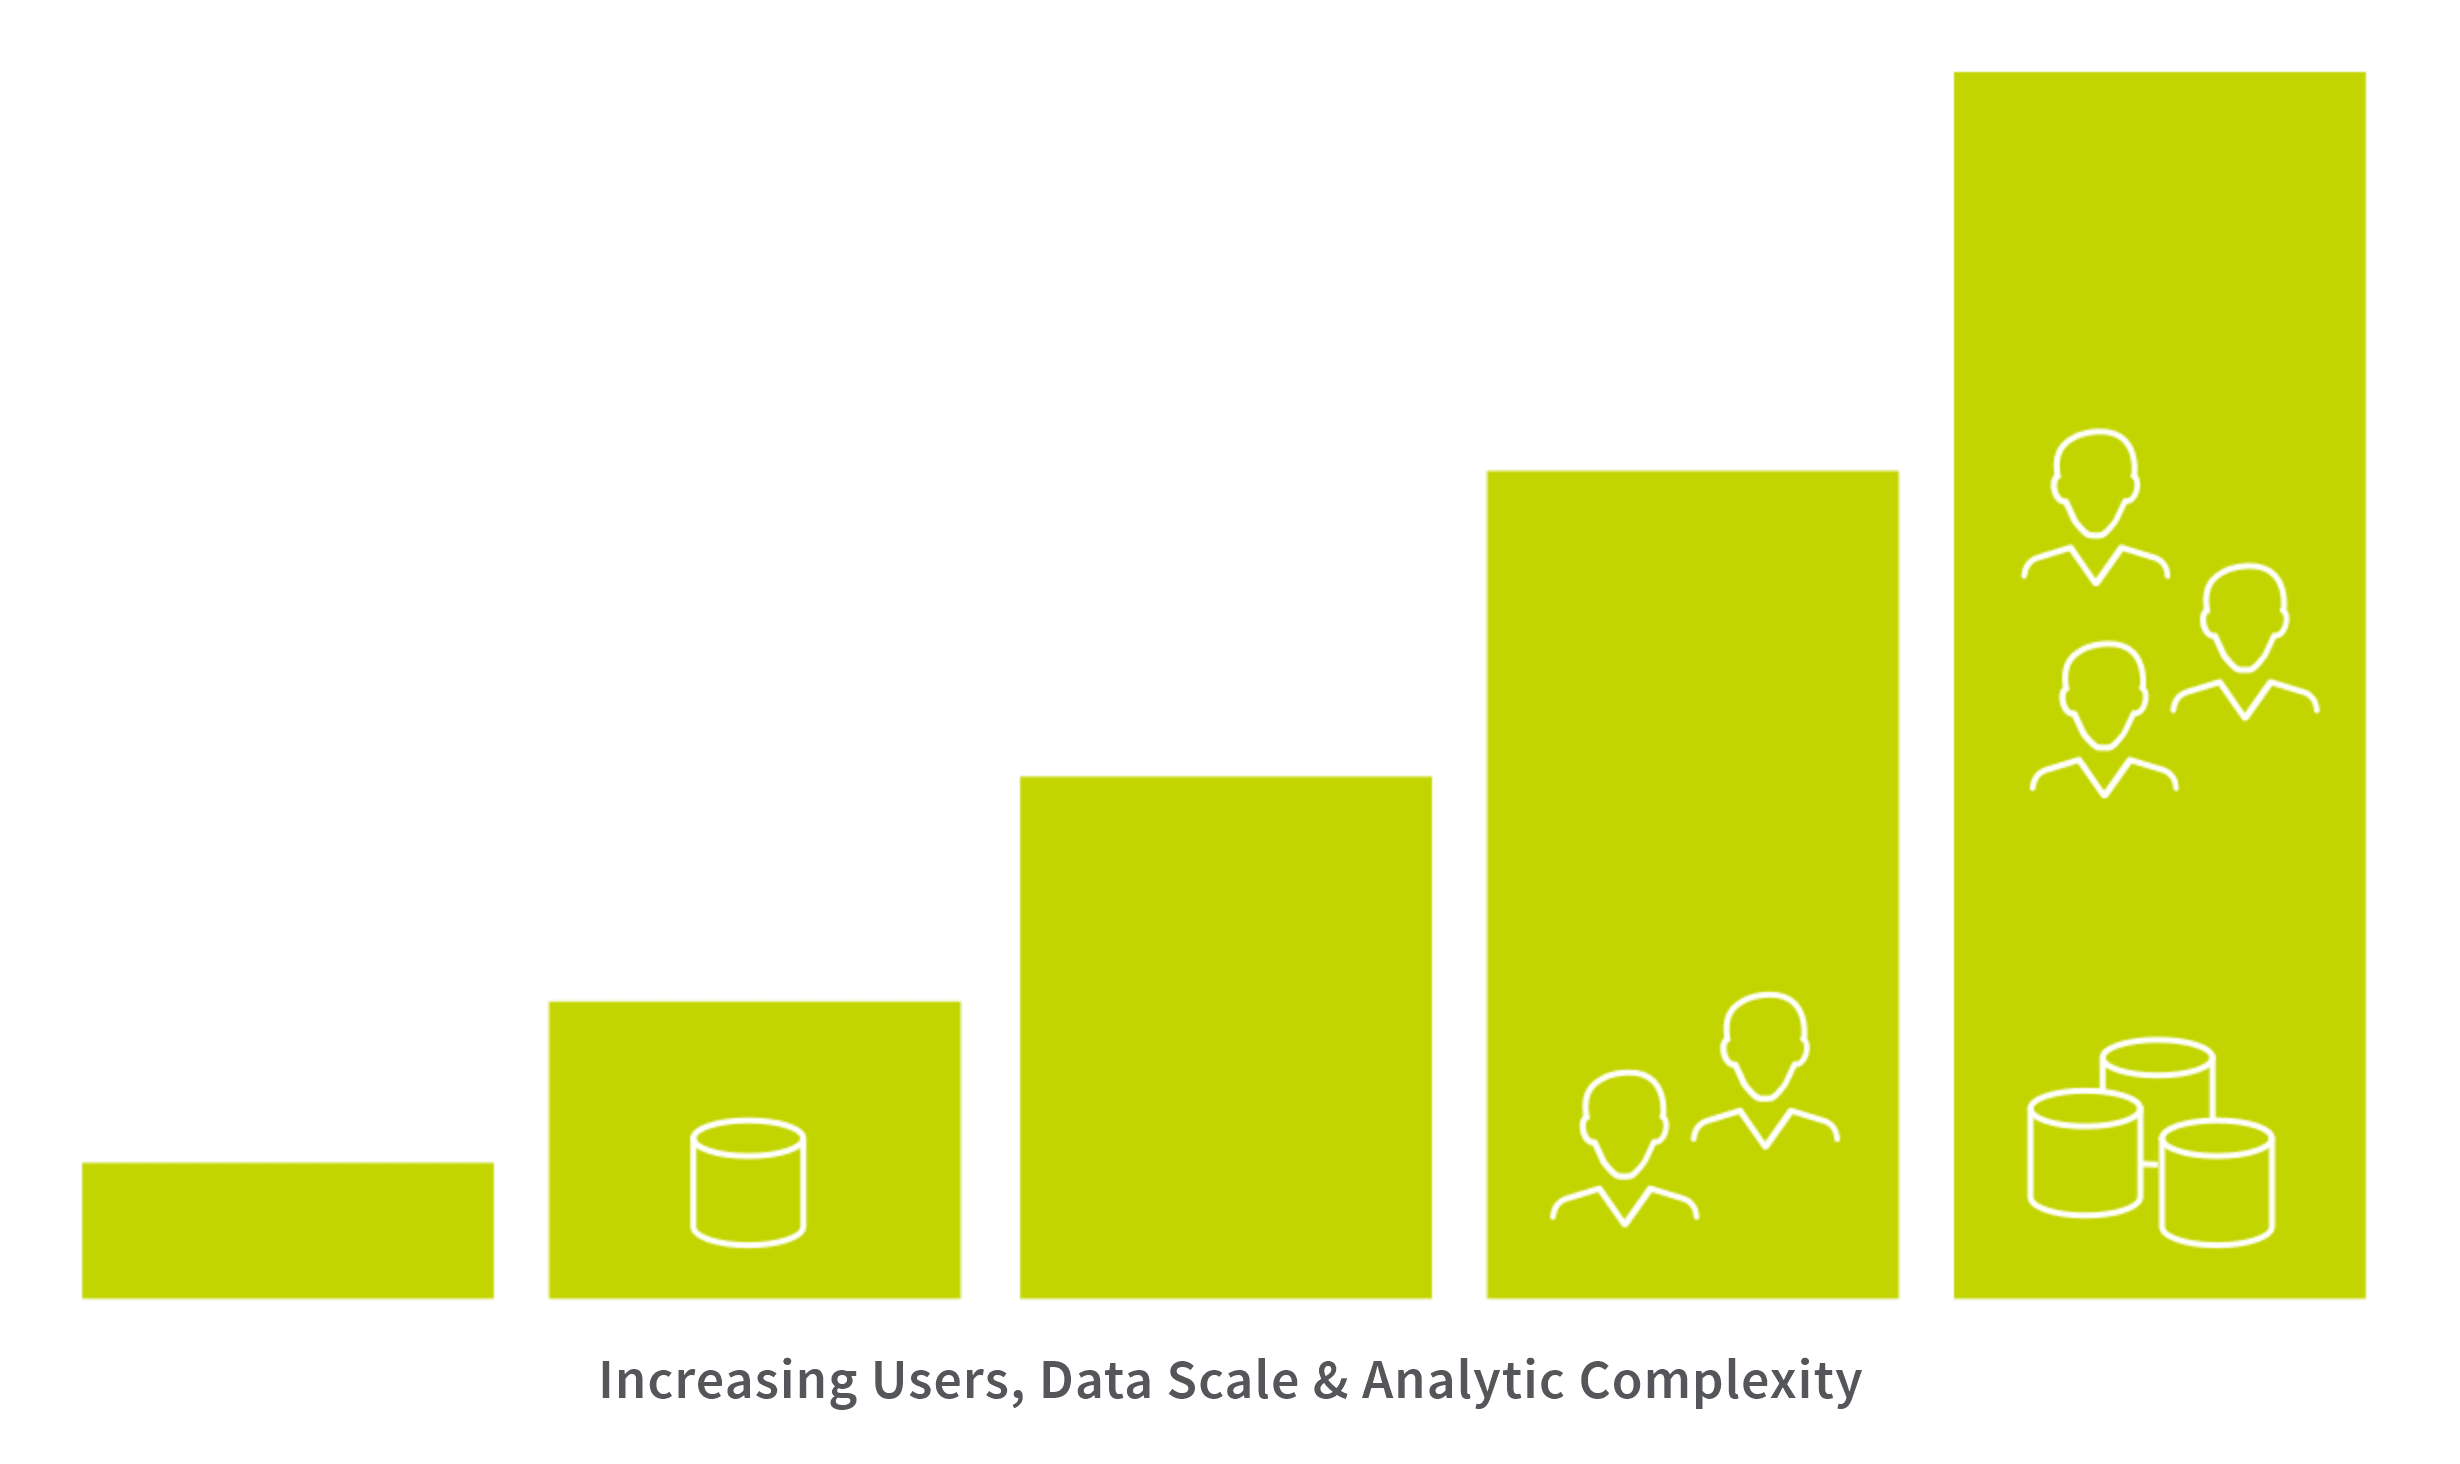
Qlik’s associative engine provides instant calculation performance, even with massive data sets, unanticipated questions, and high numbers of users. And, with Qlik's robust incremental update and partial reload features, you can keep data fresher in a much smaller build window.
Tableau
Tableau’s engine slows dramatically when it tries to handle large volumes and disparate data, especially when attempting complex analytics. And trying to scale this across 1,000s of users will only make performance worse.
“Near the beginning of our journey with the analytics platform Qlik, we had about 2,000 users. However, as word spread, the number of interested staff grew exponentially. Roughly a year later in 2020, we had nearly 20,000 users on the platform. As of the first quarter of 2021, more than 35,000 people were engaged.”
-Axel Goris, Upshot by Influitive Interviews
Qlik Sense
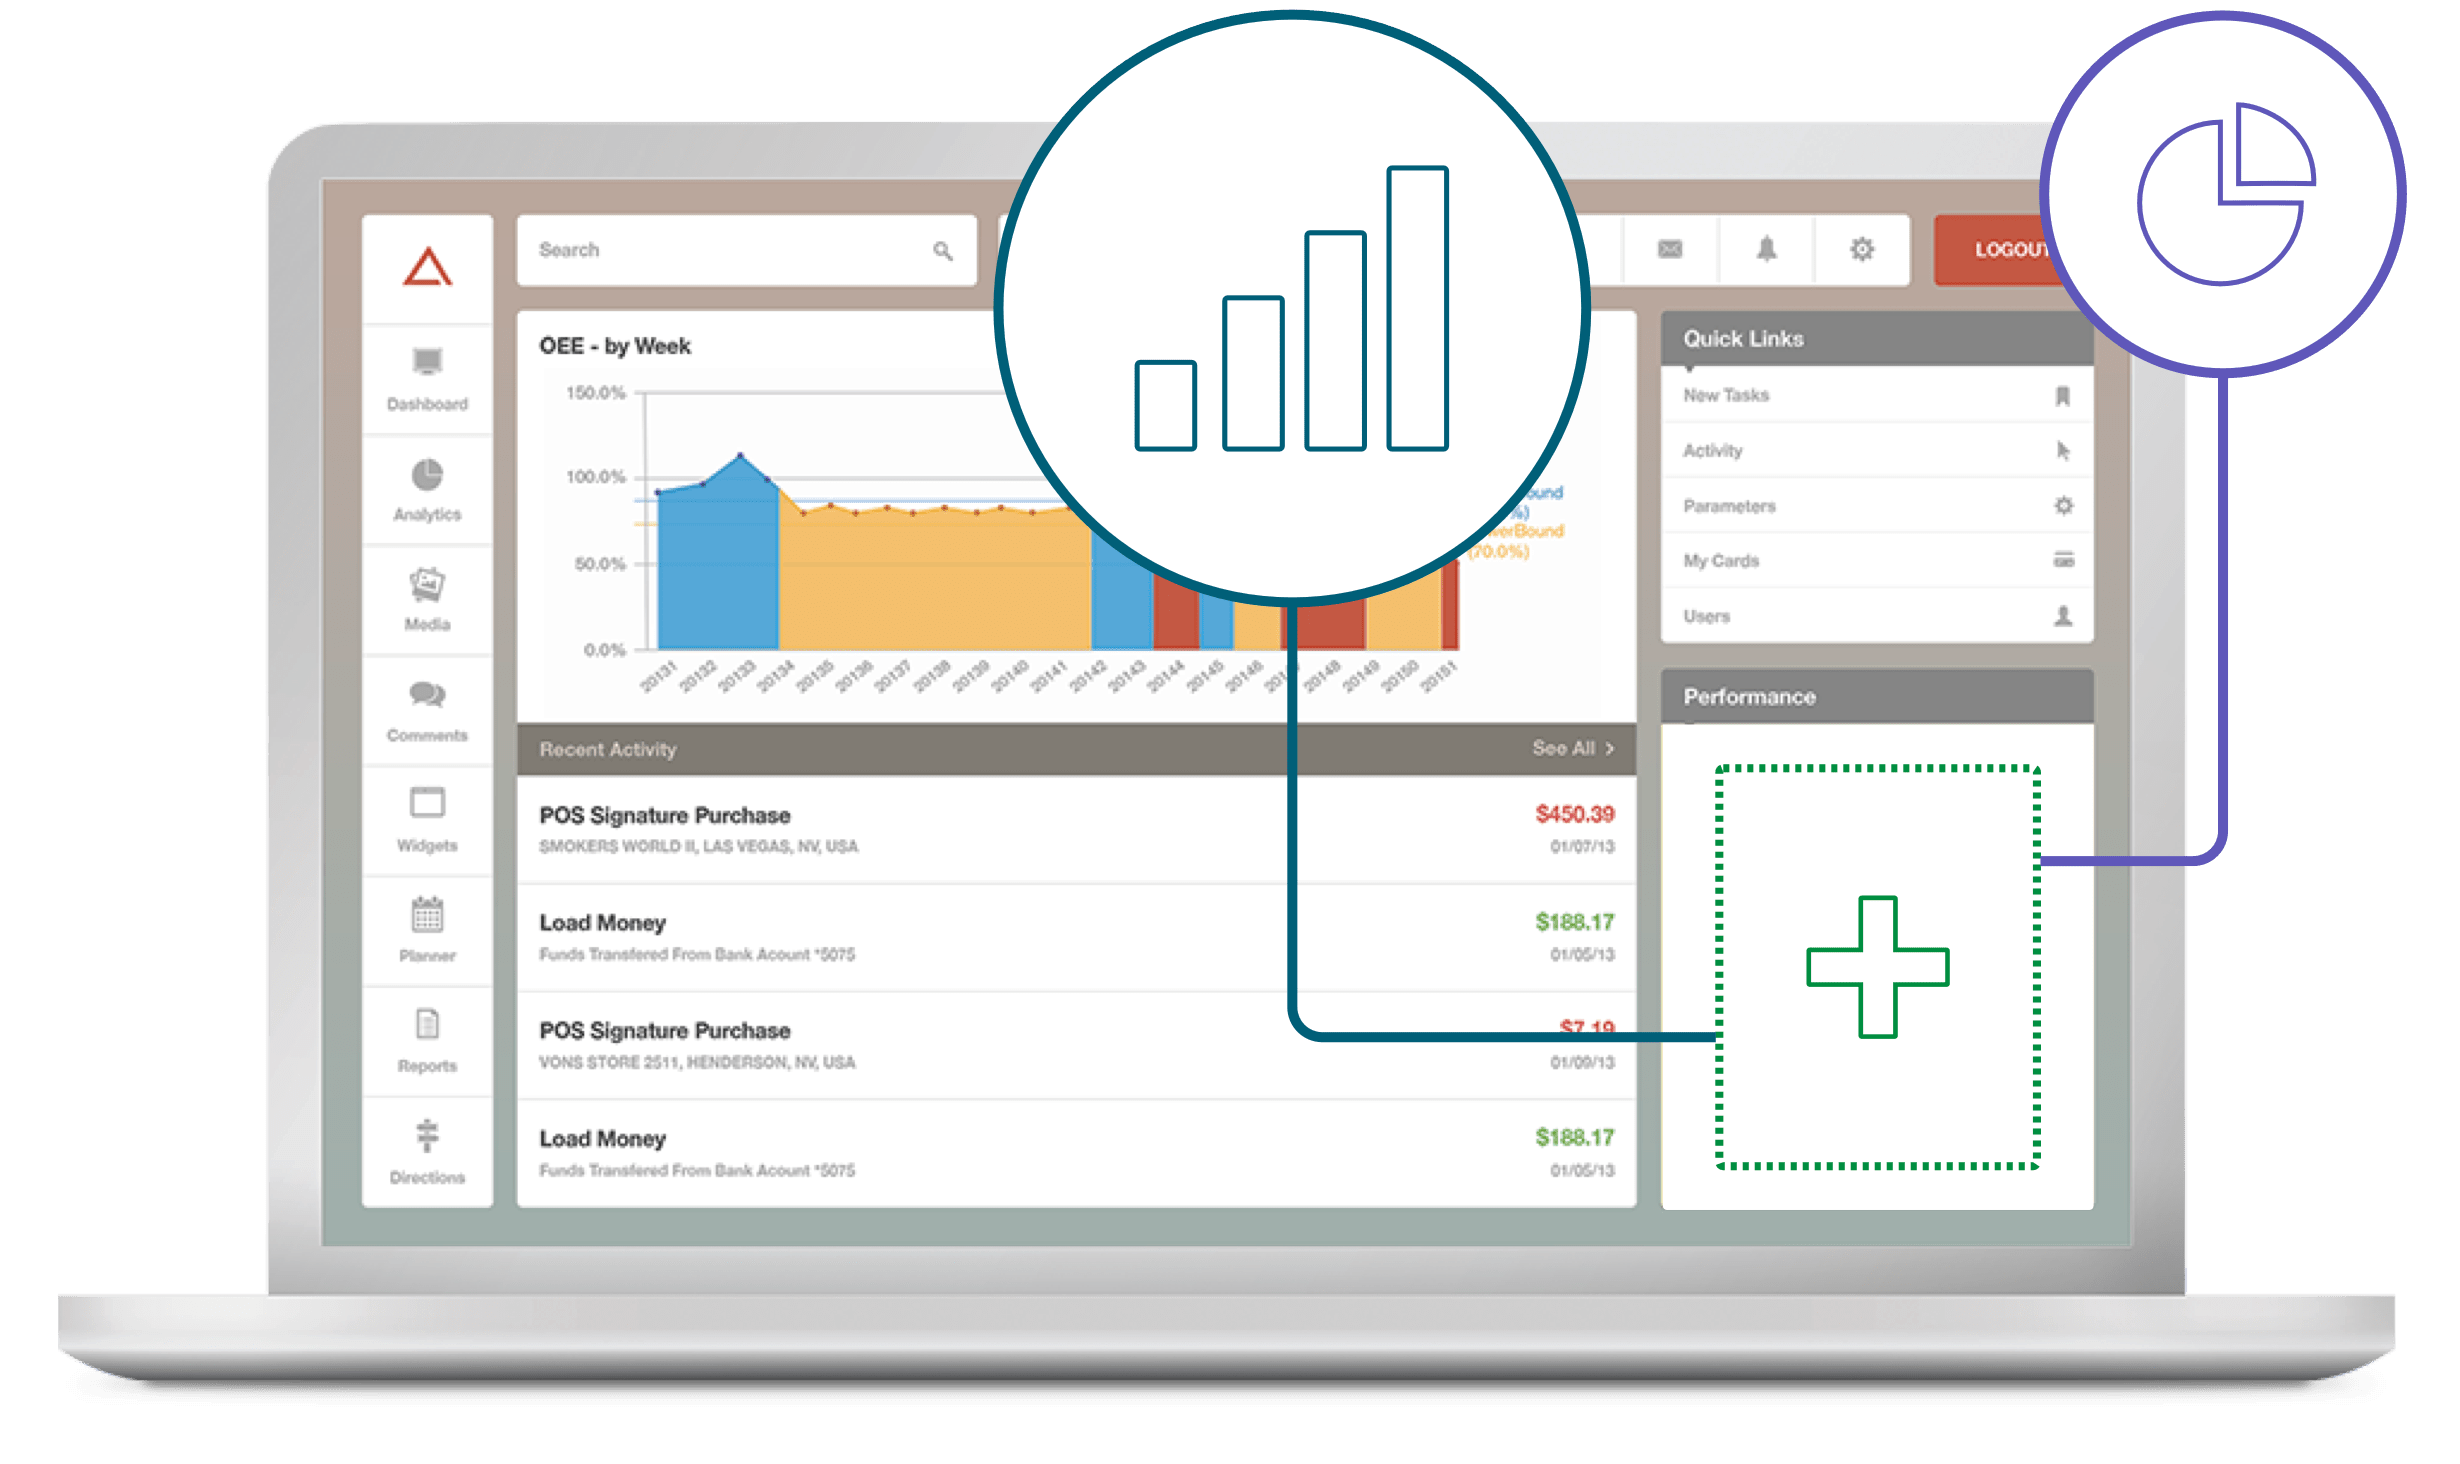
Qlik’s platform was built API-first using modern standards. This means you can embed a dashboard–and individual numbers, values, and metrics–within the latest web and application technologies.
Tableau
Tableau’s APIs are limited, which means you can only embed a complete dashboard, not individual values.
“Qlik’s complete set of open APIs enables us to fully customize analytics solutions, rapidly develop new custom apps, visualizations, and extensions, and embed fully interactive analytics within the applications people use every day.”
- Aaron Growitz, Upshot by Influitive Interviews
Qlik Sense
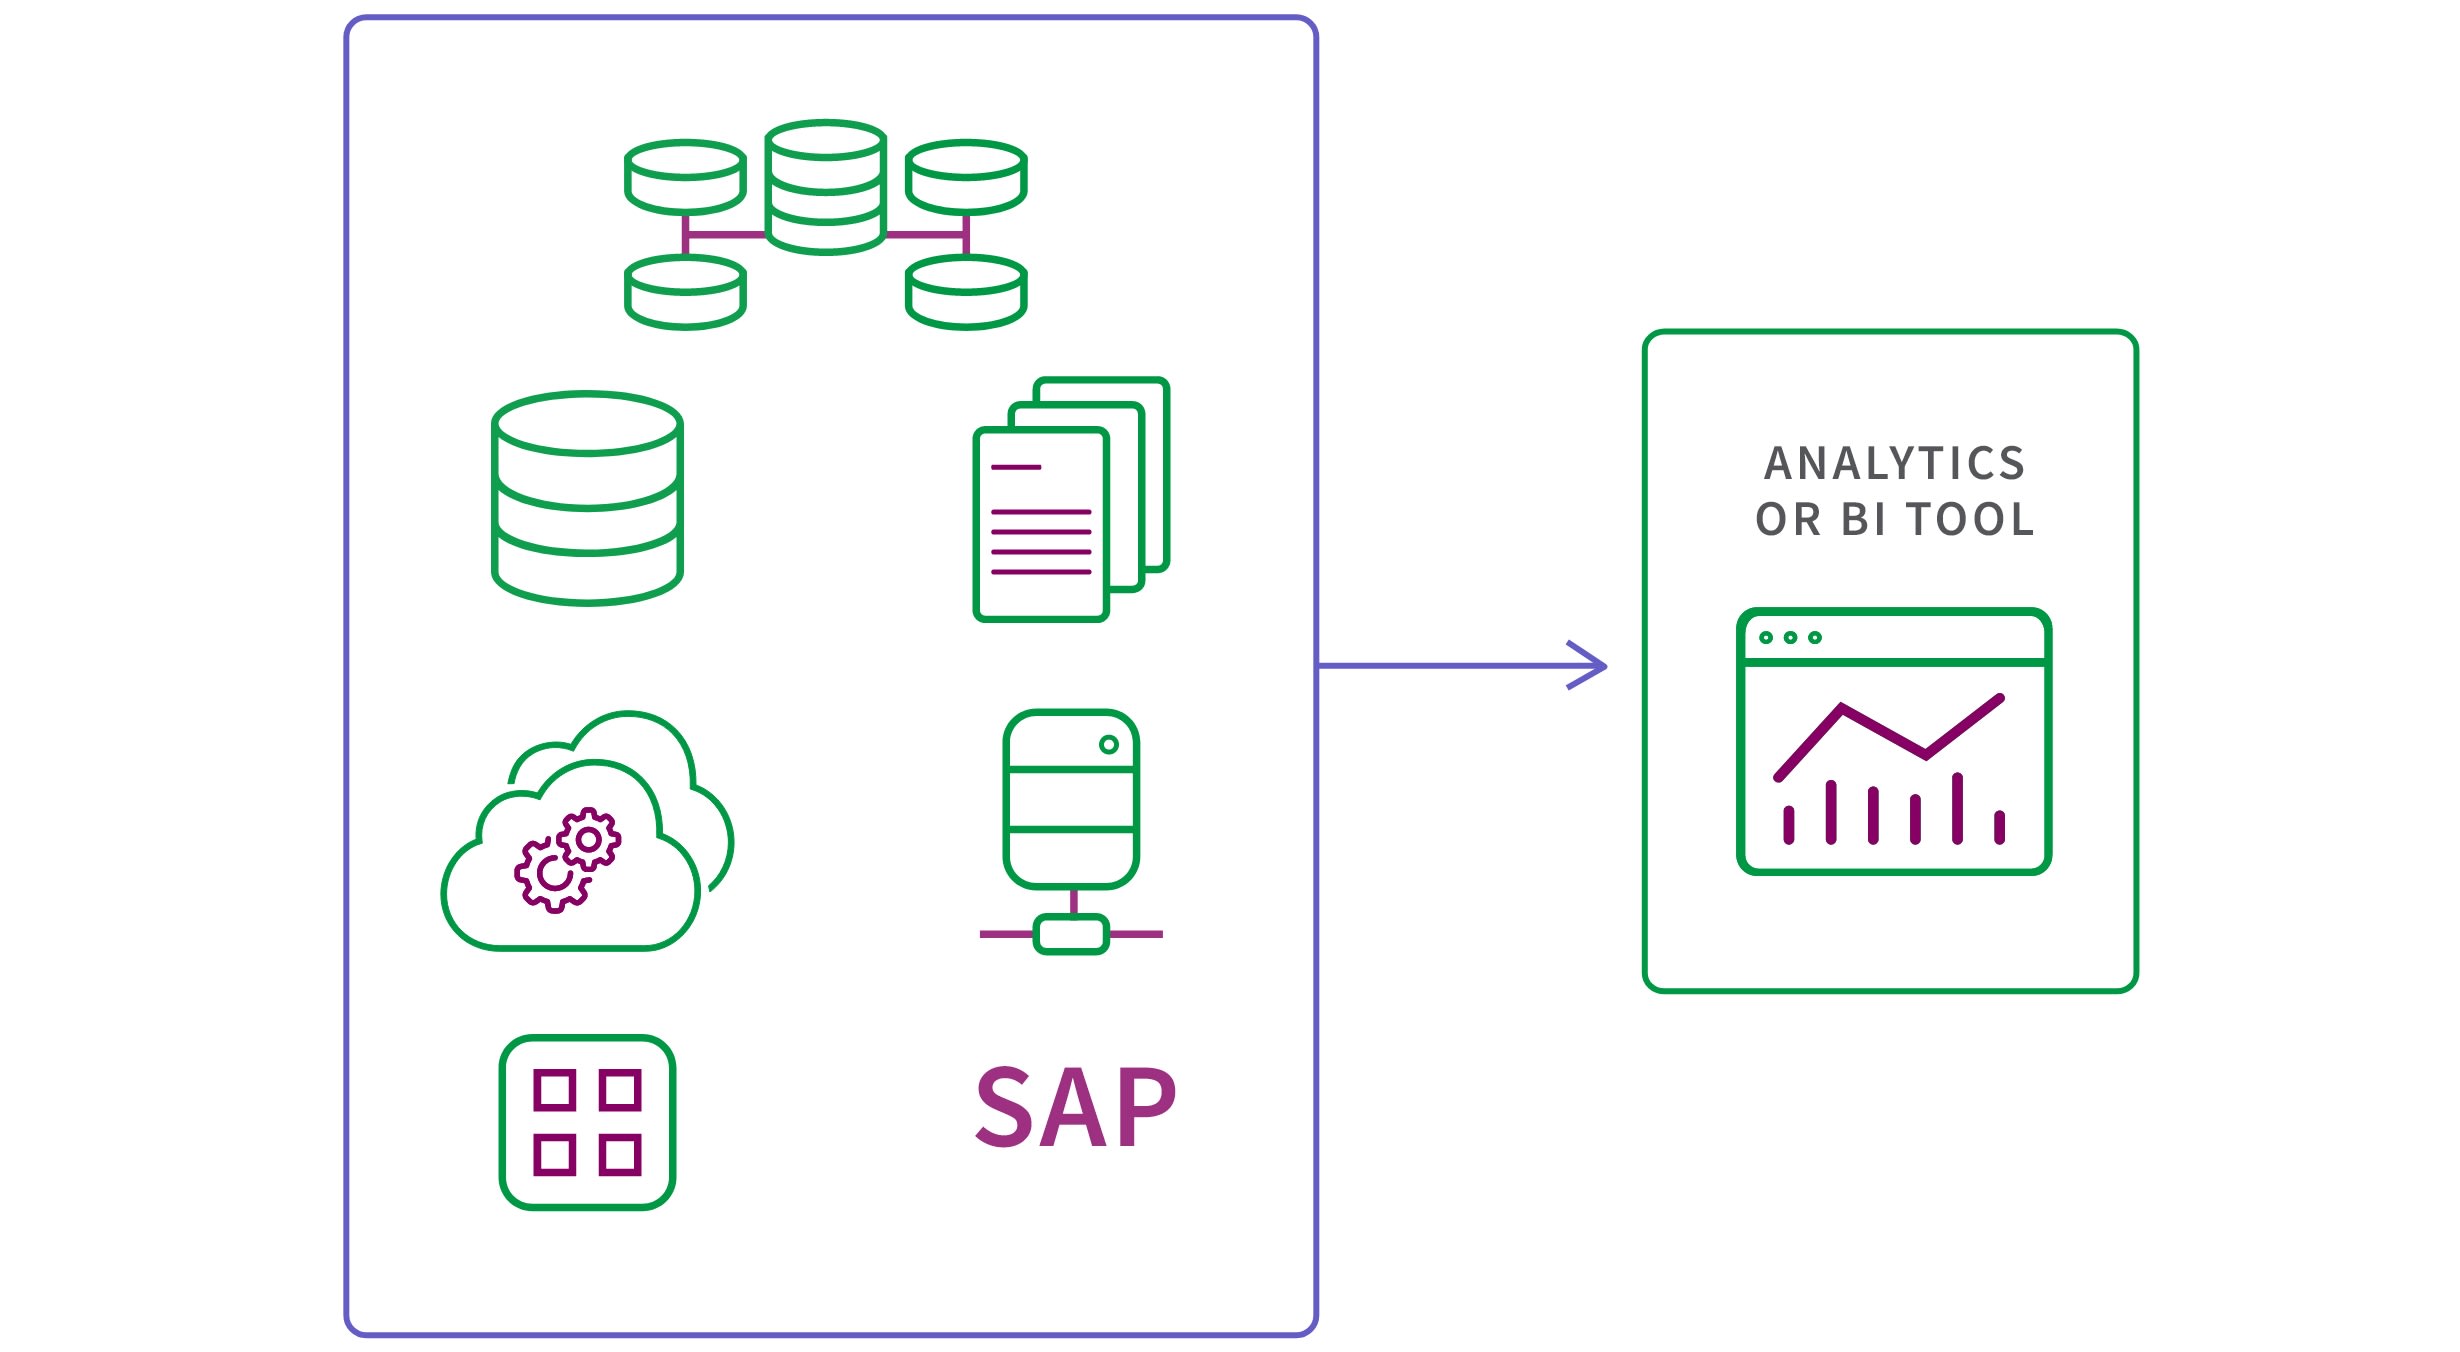
Qlik’s associative engine is the key to combining many different types of data from many different sources, at scale, without the limitations of SQL-joins. And, with both graphical data transformation and powerful scripting, you can deal with the most complex of data preparation challenges.
Tableau
Tableau Prep and Tableau Desktop do provide data prep capabilities. However, both struggle in different ways at combining and preparing complex data at scale. For example, Tableau Prep creates a flattened data table while Tableau Desktop simply doesn’t scale. This requires you to find other solutions for data prep.
“Databases can be huge, with information coming from multiple sources. Qlik’s associative selection model and powerful data engine make it simple to turn piles of data into wisdom.”
-Sandra Norman Andersen, Upshot by Influitive Interviews
Qlik Sense
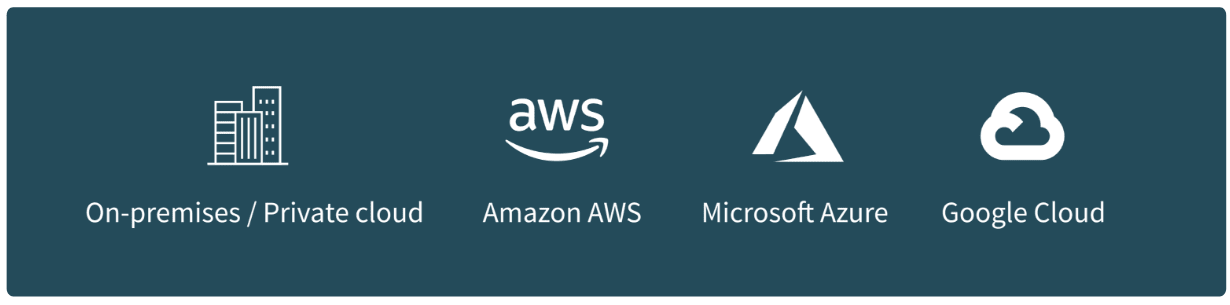
As an independent platform, Qlik offers you total freedom and control for your data, whether it resides in one or more cloud environments or on-premises. Qlik provides a full enterprise SaaS environment and on-premises or private cloud deployment options. Learn about Qlik Cloud.
Tableau
With Tableau, you host it or they do - there is no hybrid option. And given that Salesforce owns Tableau, you might wonder where your data could end up and whether it could get locked in, especially with the launch of Salesforce Data Cloud.
Tableau
Tableau requires you to be an author to interact with data and to benefit from Tableau’s data literacy initiative. All other users have to go back to the author for a new report when they want to explore deeper.
“We use features like Qlik Continuous Classroom to help people to develop data literacy.”
-Vladimir Baklanov, Upshot by Influitive Interviews