
Homeownership, racial segregation, and policy solutions to racial wealth equity
About the Authors


Homeownership is often viewed as the entree to the American dream and the gateway to intergenerational wealth. However, this pathway is often less achievable for Black Americans who post a homeownership rate of 46.4% compared to 75.8% of white families.[1] Compounding matters, homes in predominately Black neighborhoods across the country are valued at $48,000 less than predominately white neighborhoods for a cumulative loss in equity of approximately $156 billion.[2] These are significant contributing factors to the racial wealth gap.
In 2016, white families posted the highest median family wealth at $171,000. Black families, in contrast, had a median family wealth of $17,600.[3] Because wealth (as measured by the total amount of assets a person owns minus debts) is a critical predictor of education, health, employment, and other quality of life metrics, a strategy to maximize homeownership and home value is needed.
Lower Black homeownership and the racial wealth gap are byproducts of systemic racism, including the legacies of slavery, Jim Crow segregation, redlining, and other anti-Black policies that targeted Black people and predominately Black neighborhoods. Residential segregation facilitates the extraction of wealth and other vital resources that fuel economic and social mobility. The loss of wealth in Black communities hastens a downward socioeconomic spiral. For instance, schools predominated by Black, Latinx, and Asian students receive $23 billion less in funding than predominately white districts.[4] This is because schools primarily rely on local property taxes rather than a broader pool of funding to equalize school resources.
Furthermore, education as a solution to closing the wealth gap is inherently flawed. White college graduates have seven times more wealth than Black college graduates.[5] This racial wealth gap reveals how little a strategy singularly focused on increasing college degree attainment will have on reducing the racial wealth gap.
Additionally, subpar neighborhood resources lead to fewer banking options, more payday lenders, and less opportunity for financial literacy. Because most people start their businesses using the equity in their homes, Black business development is throttled by Black families’ lack of homeownership and lack of wealth overall.
Recent public policy has not helped matters. The federal government’s first Covid-19 relief package may have exacerbated the problem. The first round of Paycheck Protection Program (PPP) loans (part of the CARES Act, the federal COVID-19 relief package) gave relief only to employer firms. This framework disproportionately excluded Black businesses: 95% of Black-owned firms are non-employer businesses, compared to 78% of white-owned firms.[6] This negatively impacted entire communities. According to a Bloomberg analysis, 27% of businesses in white-majority congressional districts received PPP loans, compared with 17% of businesses in districts where minorities make up more than half the population.[7] A Stanford University study estimated that over 40% of Black-owned small businesses closed during the COVID-19 pandemic.[8] A report examining COVID-19 disparities in Detroit found that small businesses in the city, compared to those in the broader Detroit area, were less likely to receive PPP loans and less likely to receive similar amounts even if loans were allocated.[9]
Segregation and racial bias are robbing Black people of opportunities to build wealth, restricting millions from reaching their potentials. At a time when America is at a precipice of a racial awakening, it is important to provide empirical research on a set of problems that if solved, can significantly improve the racial wealth gap.
At a time when America is at a precipice of a racial awakening, it is important to provide empirical research on a set of problems that if solved, can significantly improve the racial wealth gap.
This report aims to provide an empirical analysis and overview of the role that racial residential segregation plays in 17 cities across the United States. Using a dissimilarity index that captures how far apart racial groups in a city live away from each other, we aim to provide information on cities and how racial disparities in housing fuel the racial wealth gap. We focus on homeownership rates and values, banks, credit scores, and educational attainment.
Methodology
For this analysis, we rely on publicly available data sources including the US Census Bureau’s American Community Survey (ACS) and the Federal Reserve System. Additionally, we utilize credit scoring data from numerous credit bureaus, accessed and compiled by the Urban Institute, as well as the ProsperityNow Scorecard. Further, we utilize credit scoring data from numerous credit bureaus, accessed and compiled by the Urban Institute, as well as the ProsperityNow Scorecard. Where possible, we center the Black population of each of the 17 cities included in the analysis, drawing comparisons when necessary to the non-Black population or white population of the city, where appropriate. We define the Black population as Black, non-Hispanic in accordance with Census conventions.
We employ a metric known as the “Dissimilarity Index,” one of many possible calculations used to measure residential segregation between two groups. The index requires that researchers choose two groups to be compared as well as a certain sub-geography of a larger area (here, cities) to compare. We choose Census Tracts, as they are the unit that best approximates our conception of “neighborhoods” for which the latest Census data are available from the 2019 ACS. In addition, we choose to compare Black populations in cities with the remainder of the city entirely, not simply the white population, as is sometimes done in studies of residential segregation. This is to account for the fact that while the cohort of cities in the analysis includes widely differing shares of Latino or Hispanic population, Black and Latino or Hispanic populations are not always spatially segregated to the same degree within cities. In recognition of the fact that residential segregation exists, the index can be thought of as a measure of the proportion of the two groups which would have to move from their current location in order to achieve an evenly spread population where each neighborhood has a representative share of each group. Cities in which a high proportion of a group would have to move are more segregated.
When we study topics other than residential segregation, such as discrepancies in home values, educational attainment, income, and more, we present data that speak to the gap between Black and white populations, rather than Black and non-Black populations. As white populations often (though importantly, not always) have higher incomes, rates of homeownership, and other outcomes often show the true effect of systemic racism for Black residents of these cities.
Where possible, we use data disaggregated by race at the city level. However, in the case of unbanked and underbanked populations, disaggregated data at the city level are not reliable. Instead, we examine the unbanked and underbanked population of the nation, disaggregated by race.
In the case of home values (as reported by the Census Bureau), data are not disaggregated by the race of the homeowner or head of household. Instead, we examine home values in Black-majority neighborhoods and compare them with home values in all other neighborhoods within the city. Some cities in the cohort do not have Black-majority neighborhoods, even if they may have neighborhoods with a high Black population, and so are not included in that portion of the analysis. Median home values are computed by the Census Bureau at the neighborhood level, but the custom sub-geography of “all Black-majority neighborhoods” requires that we compute medians by hand. Rather than employing a cruder estimate of the true median, we more accurately estimated the median home value of homes in all Black-majority neighborhoods in a given city by summing the recorded tallies of homes within each income band and then interpolating linearly within the median band. The same process is used by the U.S. Census Bureau to calculate median estimates for all non-custom geographies for which they disseminate data.
Findings
Segregation of Black residents persists in cities.
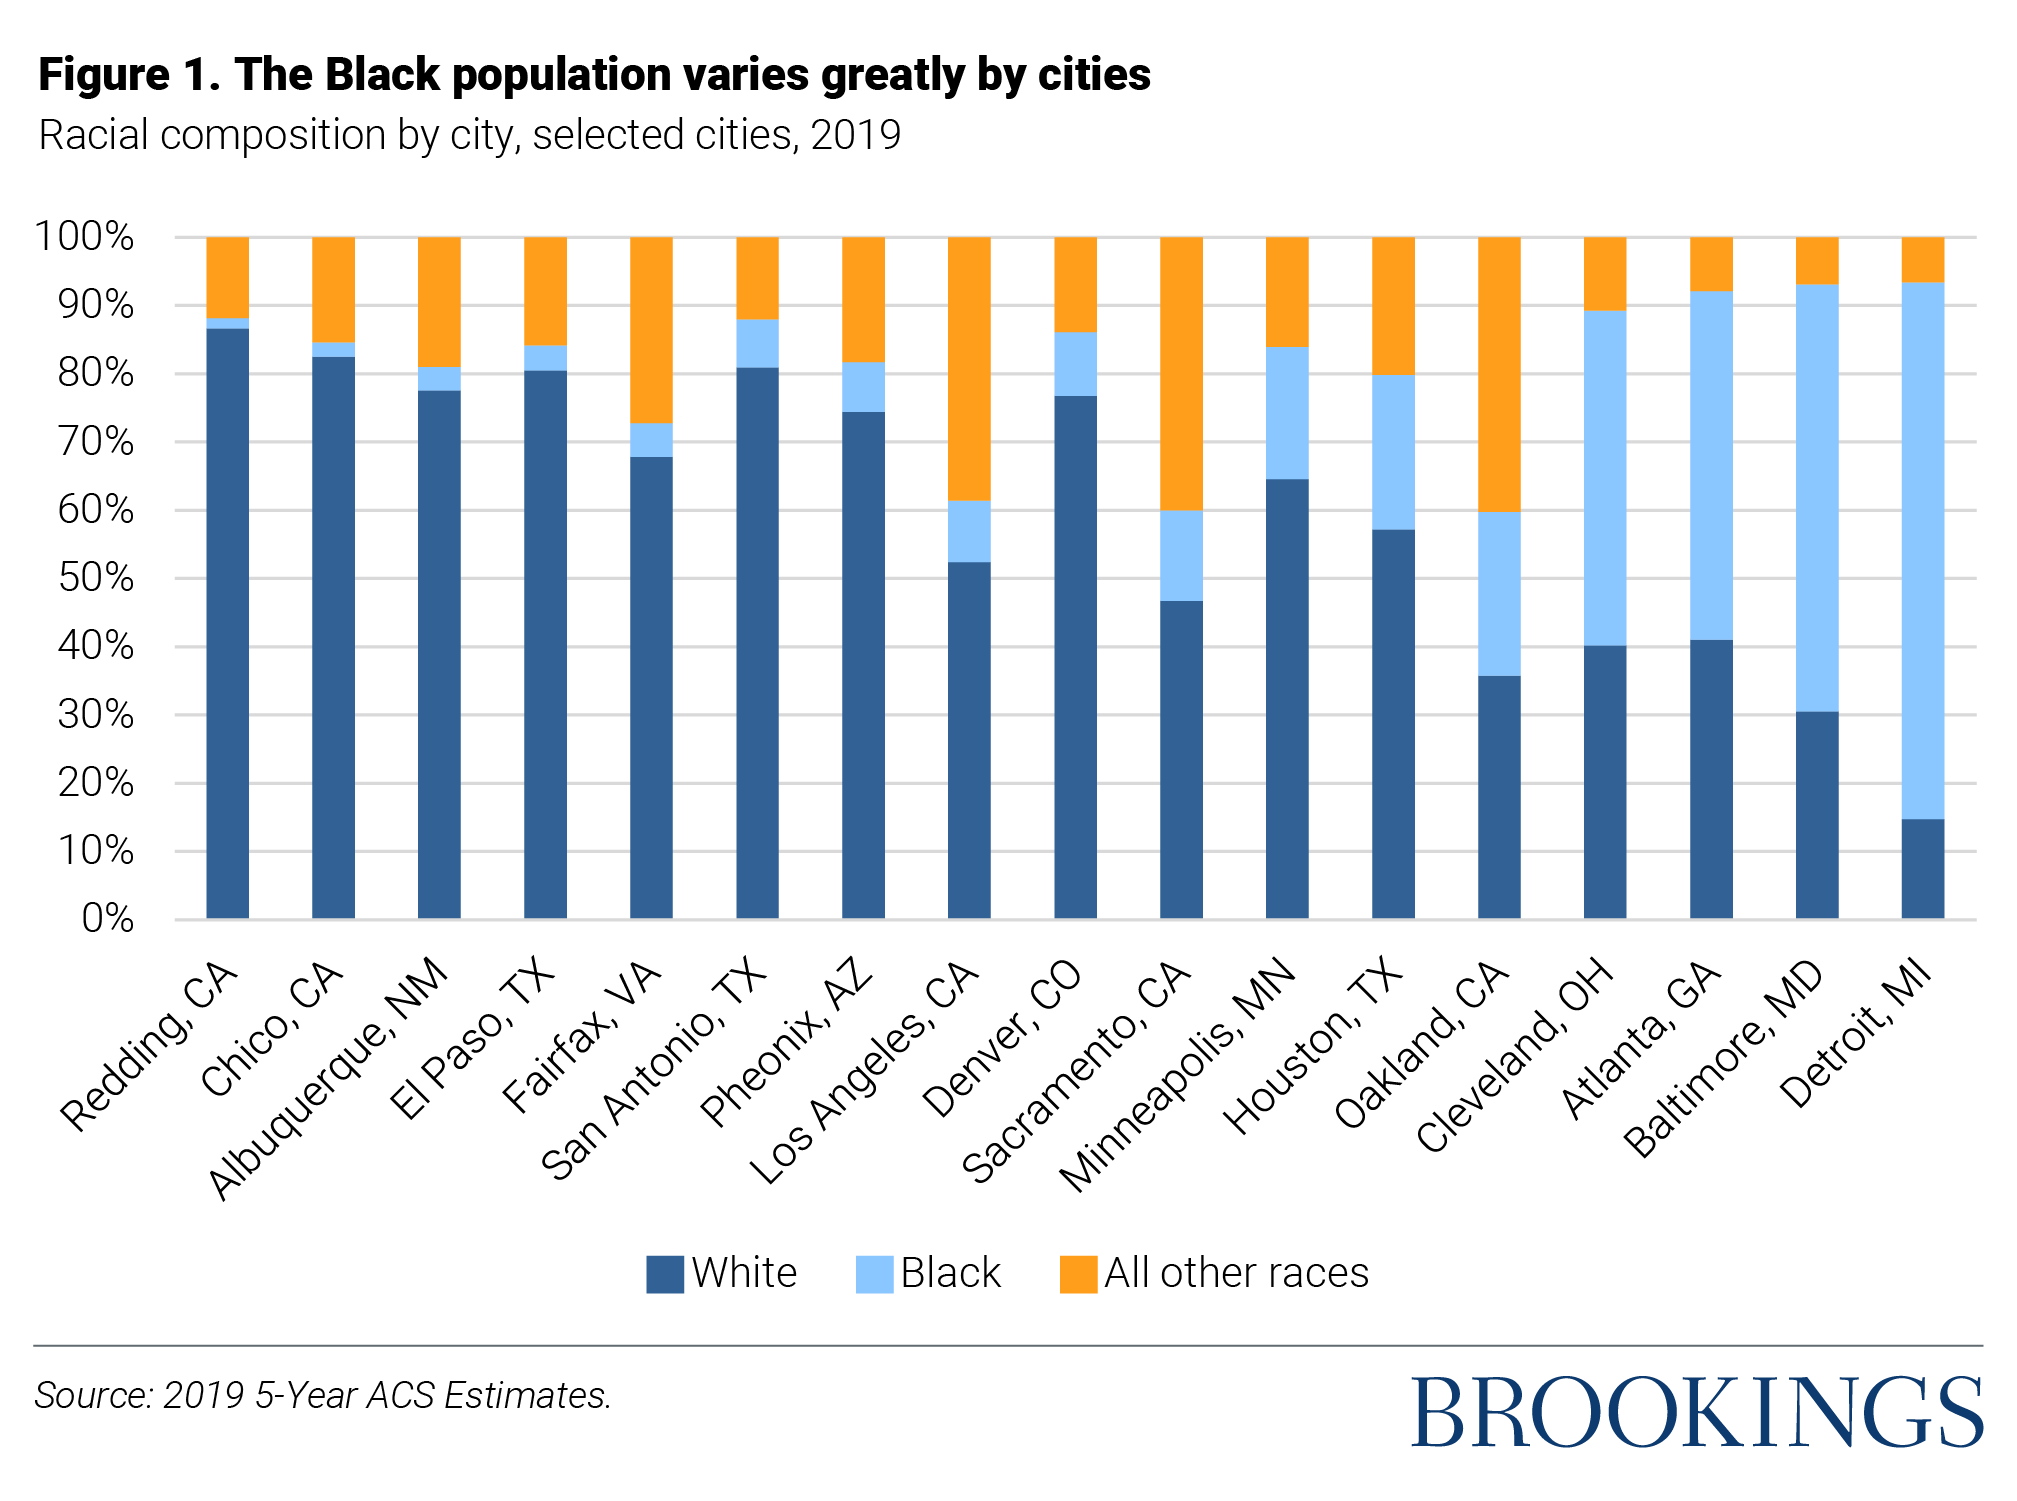
There are significant differences in the racial compositions of the cities in this analysis.[10] In Redding, Chico, Albuquerque, El Paso, Fairfax, San Antonio, Phoenix, Los Angeles, and Denver, under 10% of the population is Black. Sacramento, Minneapolis, Houston, and Oakland have populations that are between 10 and 25% Black. Proportionally, the largest Black populations are located in Cleveland, Atlanta, Baltimore, and Detroit. With the exception of Cleveland, in which 48.8% of residents are Black, these cities are more than 50% Black. Detroit has the largest percentage of Black residents in the sample at 78.3%.
To measure the extent to which Black residents are segregated from other racial groups in the cities, we utilized indices of dissimilarity. The dissimilarity index represents the percentage of one of the two groups included in the analysis that would have to move in order to achieve racial compositions within smaller geographic units that match the racial composition of the entire city. A value of 0 represents a completely integrated city, while a value of 1 represents a completely segregated city in which 100 percent of one group would have to move to achieve integration. Generally, indices above 0.6 are considered high, indices between 0.3 and 0.6 are moderate, and indices below 0.3 are low.[11]
In this report, dissimilarity indices represent the levels of segregation between the Black, non-Hispanic population of a city and the remainder of the city population, using Census tracts as the geographic unit of analysis. Racial segregation has a range of consequences, and often results in a dearth of resources such as parks[12] and well-funded schools[13] in majority-Black communities.
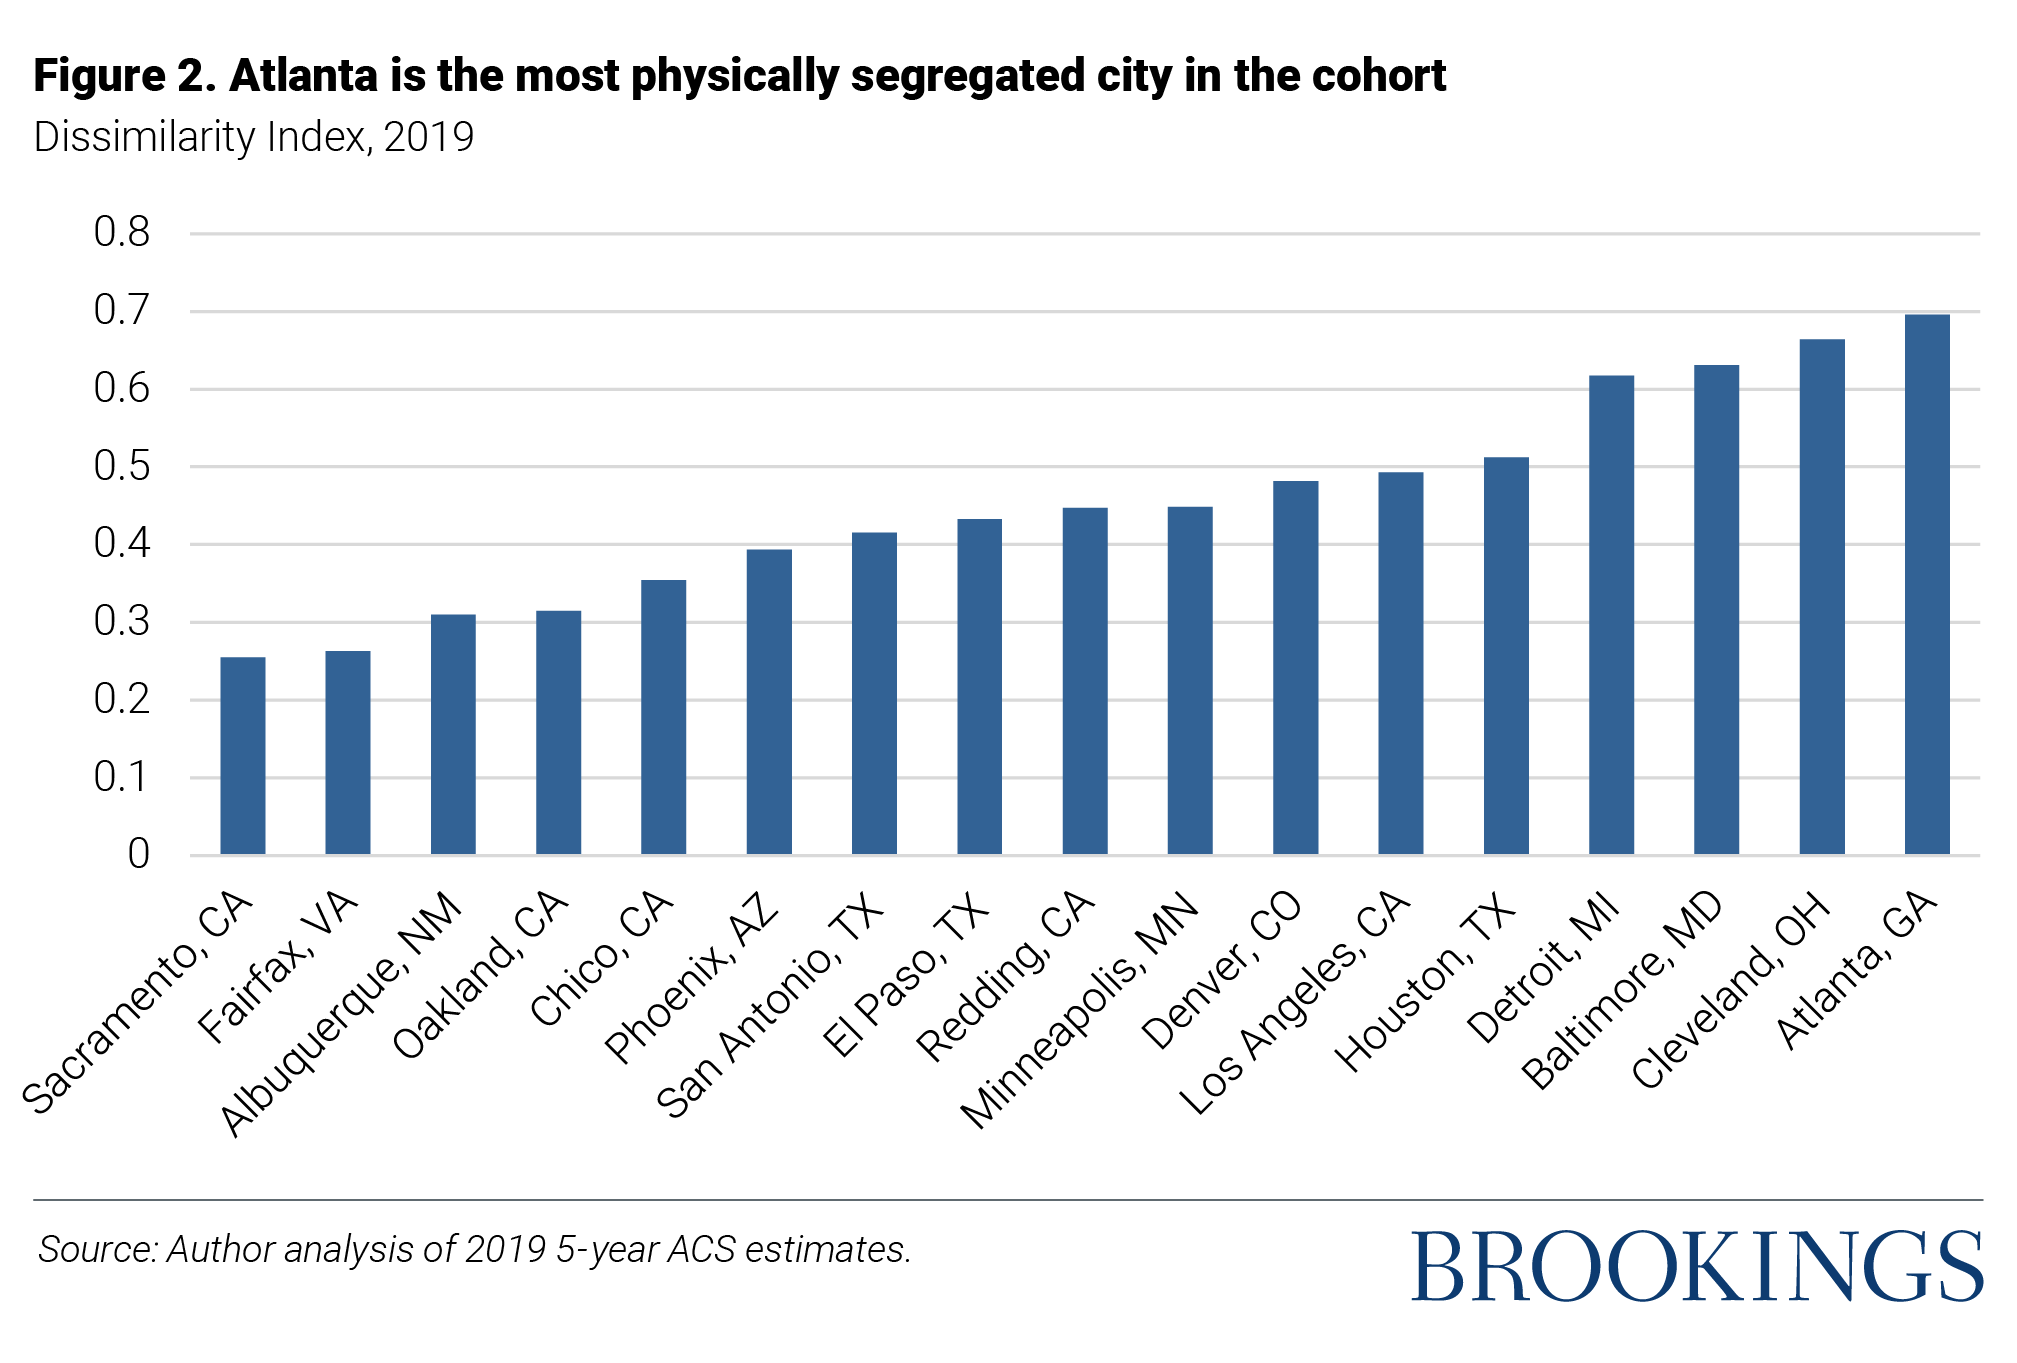
Based on these cutoffs, only two cities, Sacramento and Fairfax, have low levels of racial segregation between non-Hispanic Black residents and the rest of the city population.[14] The majority of cities exhibit moderate levels of segregation of Black residents. In Albuquerque, Oakland, Chico, Phoenix, San Antonio, El Paso, Redding, Minneapolis, Denver, Los Angeles, and Houston, between 30% and 60% of the Black population would have to move to a new Census tract to achieve a uniform distribution of Black residents.
Black residents are extremely segregated from the rest of the population in four cities, with dissimilarity indices above 0.6: Detroit, Baltimore, Cleveland, and Atlanta. In Atlanta, the city with the highest levels of Black segregation in our sample, almost 70% of Black residents would have to move to new Census tracts to produce racial distributions within Census tracts that match that of the larger city. Notably, these four cities also have the highest proportions of Black residents in the sample, which reflects the impact of historic and modern policies aimed at segregating cities, particularly those with large Black populations.
Black residents are extremely segregated from the rest of the population in four cities: Detroit, Baltimore, Cleveland, and Atlanta.
Black residents face significant barriers in becoming homeowners.
There are significant gaps in homeownership rates between Blacks and whites. The homeownership rate is defined as the ratio of owner-occupied units to all occupied units based on data from 2019. Homeownership rates are important to examine because owning a home is an essential step in building wealth.[15]
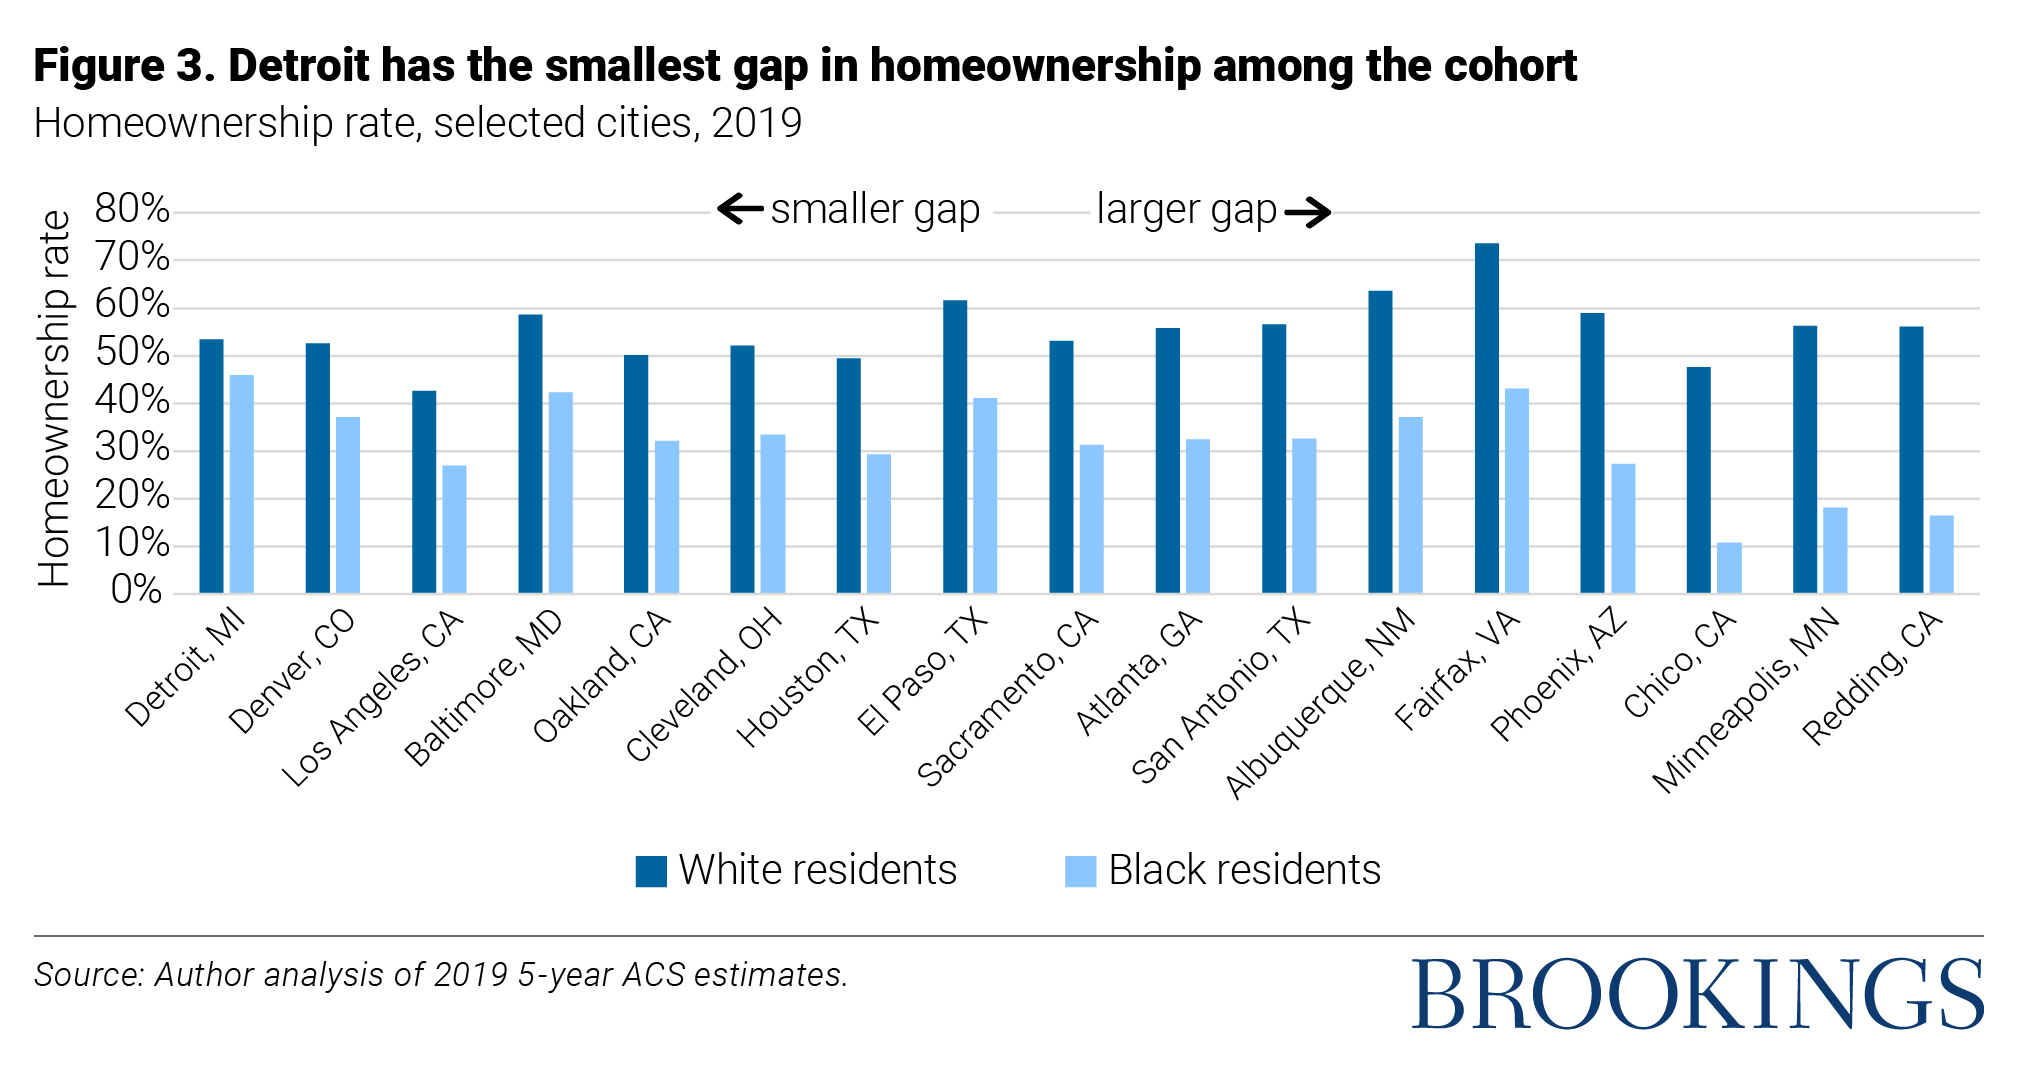
Among Black homeowners, housing comprises about 37% of total wealth, compared to about 32% for white homeowners.[16] Financial difficulties brought on by COVID-19 threaten to exacerbate the racial homeownership gap further, especially as the federal forbearance program expired June 30, 2021.[17] Only one city, Detroit, has a gap in homeownership rates between Black and white residents under 10% with Blacks owning homes at a rate of 45.9% and whites owning homes at a rate of 53.4%.[18]
There are five cities with gaps in Black and white homeownership that range from 15% to 20%: Denver, Los Angeles, Baltimore, Oakland, and Cleveland. Rates of Black homeownership in this group of cities range from 27% in Los Angeles to 42.36% in Baltimore. In contrast, Los Angeles is the only city in this group in which the homeownership rate for whites is under 50%.
In Houston, El Paso, Sacramento, Atlanta, San Antonio, and Albuquerque, the gap in homeownership rates between Blacks and whites is between 20% and 30%. Again, the majority of whites own their homes in every city in this group except Houston (which is slightly below 50% for whites). The highest Black homeownership rate of these cities, 41.08%, is in El Paso.
Among cities in this report, Fairfax, Phoenix, Chico, Minneapolis, and Redding have the biggest Black-white disparities in homeownership rates with differences of over 30%
Fairfax, Phoenix, Chico, Minneapolis, and Redding have the biggest Black-white disparities in homeownership rates with differences of over 30%. Chico, CA has the lowest Black homeownership rate with only 10.82% of Black residents owning their homes. The largest observed Black-white gap in homeownership rate is in Redding, CA, with 56.14% of whites owning homes compared to only 16.53% of Blacks. With the exception of Minneapolis, these cities all have relatively small proportions of Black residents. Furthermore, all of these cities have dissimilarity indices under 0.6. Although levels of spatial segregation are lower in these cities than in others in our sample, Black residents face significant barriers in becoming homeowners, limiting their opportunities to build intergenerational wealth.
Homes in majority-Black neighborhoods are significantly devalued.
Black residents are less likely to own homes in all of these cities, and when they do successfully obtain a home, it is often devalued. There are countless stories of Black homeowners receiving low home appraisals until a white friend stands in.[19] For instance, in Denver, a biracial couple hoped to renovate their home and received an initial appraisal of $405,000. During this appraisal, Lorenzo, a Black man, was at home with the couple’s children. The couple got a second appraisal, and this time, Gwen, a white woman, stayed home. They received an appraisal of $550,000, a $145,000 increase.[20]
Beyond discrimination in individual appraisals, homes located in majority-Black neighborhoods have been chronically undervalued,[21] further exacerbating the racial wealth gap. To examine differences in home values by race, we compared the median value of homes in Black-majority Census tracts to the median value of homes in all other Census tracts. Chico, Redding, Sacramento, Denver, Albuquerque, El Paso, San Antonio, and Fairfax have no majority-Black Census tracts and are thus excluded from the analysis.
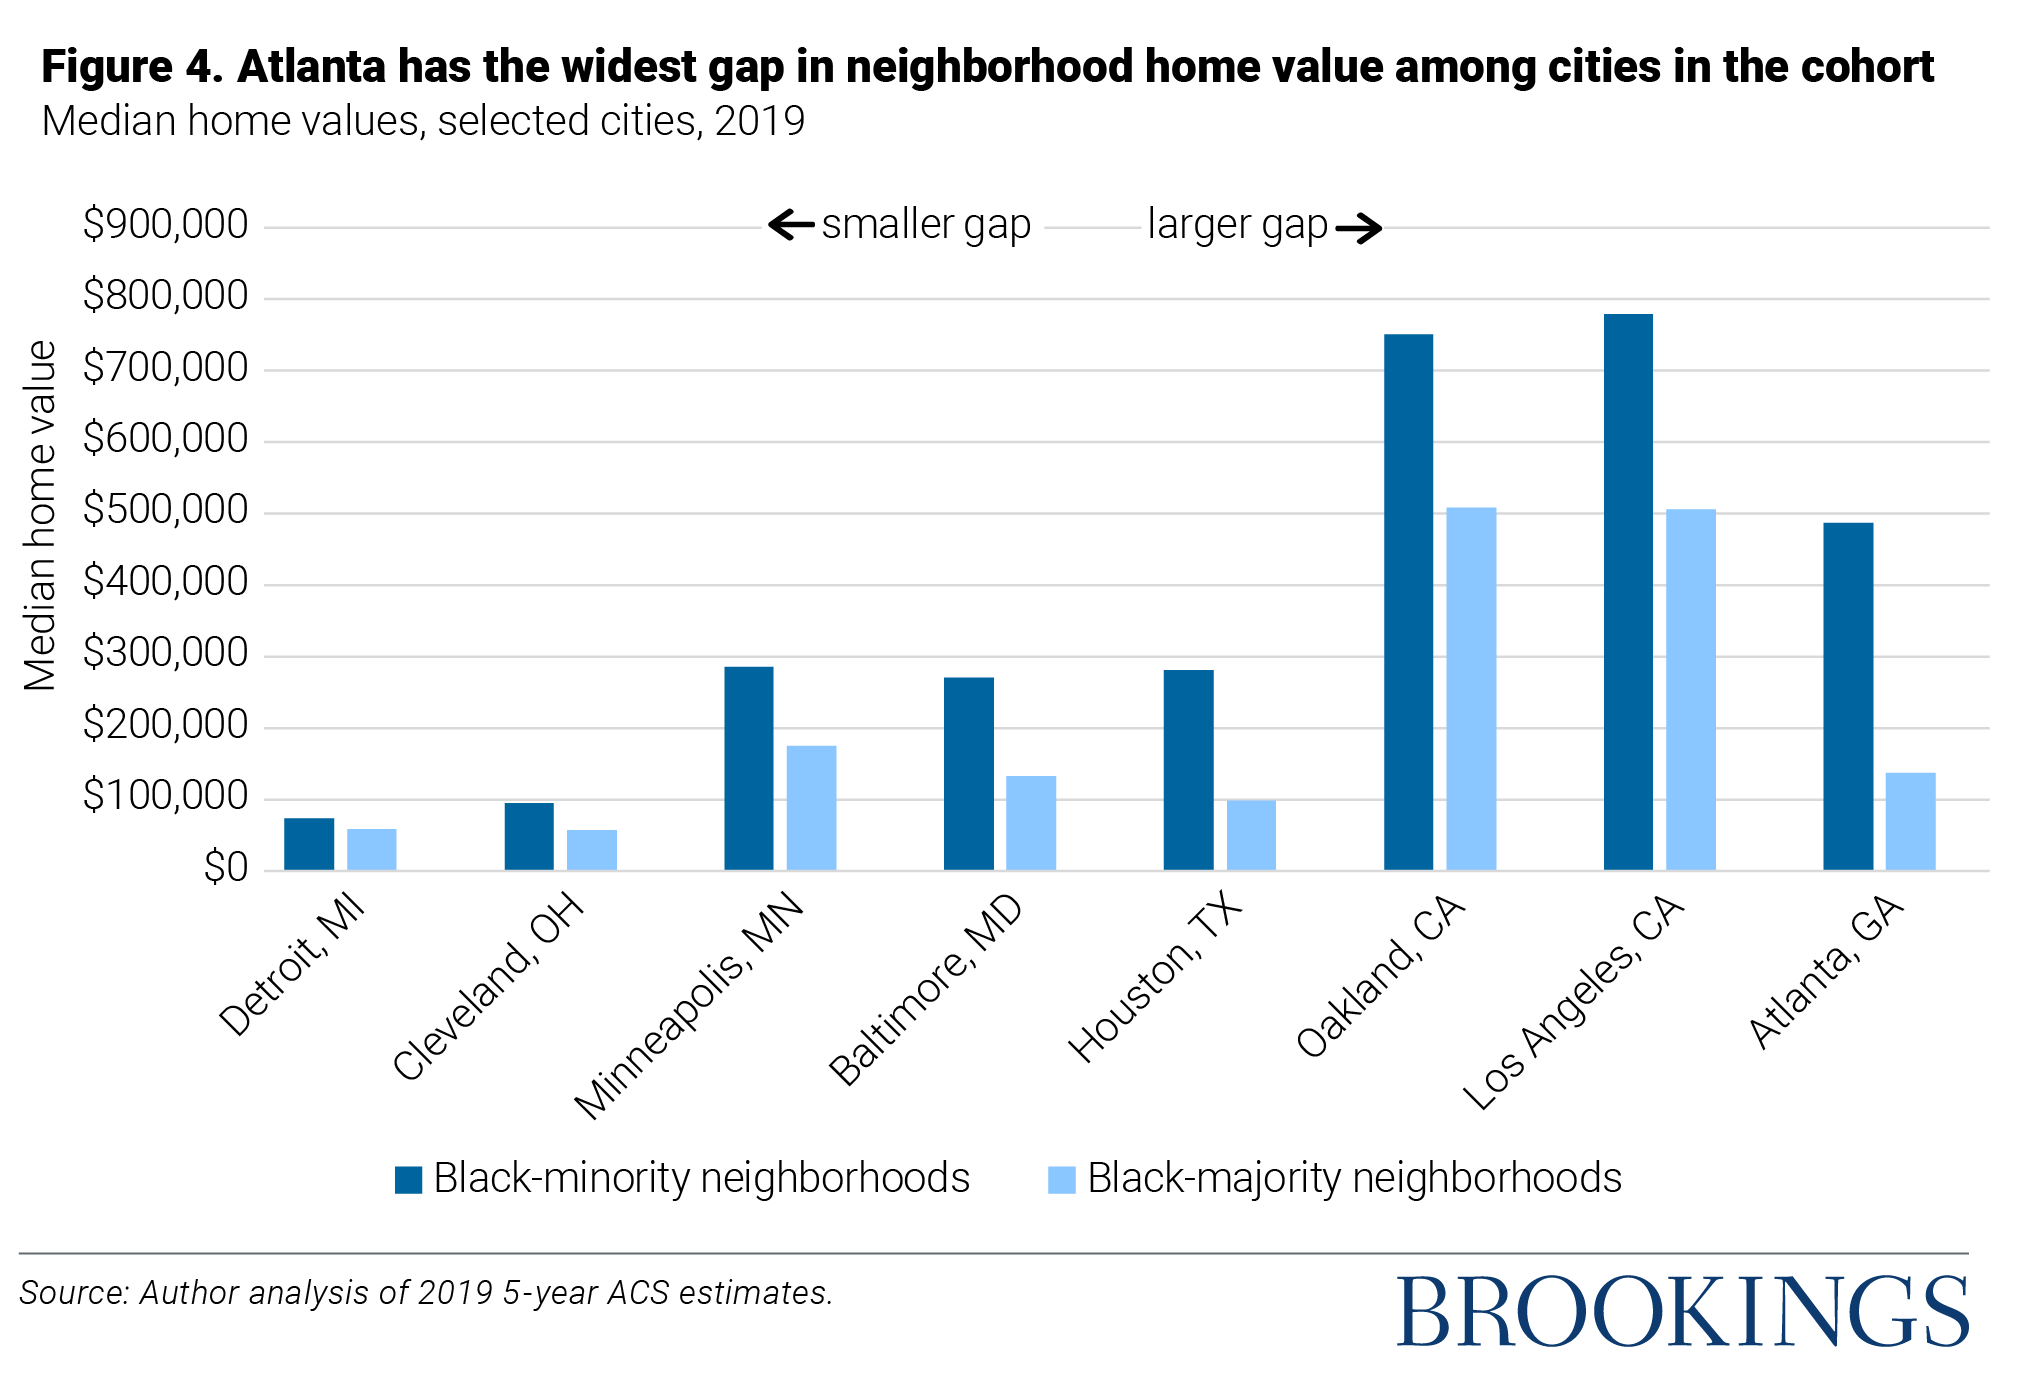
Detroit has the smallest gap in median home value between Black-minority and Black-majority neighborhoods, with homes in Black-minority neighborhoods worth about $16,043 more than those in Black-majority neighborhoods. In Cleveland, homes in Black-minority neighborhoods were valued at median prices almost twice as high as homes in Black-majority neighborhoods, with a gap in median home value of $38,297. Shockingly, these are the only two cities in the sample in which the gap in median home values is under $100,000.
In Minneapolis, the median value of homes in Black-minority neighborhoods is also almost twice as high as the median value of homes in Black-majority neighborhoods. Since housing costs are higher in Minneapolis than in Cleveland, this amounts to a difference in median value of $110,625. A similar pattern exists in Baltimore, with the median home in Black-minority neighborhoods worth over twice as much, or $138,627 more, than the median home in a Black-majority neighborhood.
In Houston, homes in Black-minority neighborhoods are valued at median prices almost three times the median prices of homes in Black-majority neighborhoods, with a difference in value of $182,092. Here, the median home value in Black-majority neighborhoods is under $100,000, while the median home value in Black-minority neighborhoods approaches $300,000.
In California cities included in this analysis, the gap in the median values of homes is extreme, partially due to exorbitant housing prices. The median value of homes in Black-minority neighborhoods in both Oakland and Los Angeles is about 1.5 times as high as the median value of homes in Black-majority neighborhoods. In Oakland, this amounts to a difference in median values of $242,212. In Los Angeles, homes in Black-minority neighborhoods are worth about $272,933 more than those in Black-majority neighborhoods.
Atlanta, the most segregated city in our sample, also exhibits the biggest racial disparity in median home values. Homes in Black-minority neighborhoods are worth almost four times, or $350,521 more than homes in Black-majority neighborhoods.
The devaluation of homes in majority-Black neighborhoods has a range of consequences. For instance, a Black man and his Japanese American wife purchased a home in 2004 in College Park, a majority-Black area outside of Atlanta, because they wanted their children to grow up in a Black community. However, low home values meant that the schools were underfunded. When they had a second child, they moved to a neighborhood with better-funded schools — this neighborhood, Candler Park, was majority-white. They sold their home in College Park in 2014 and received $144,000 less than they initially paid for it, with no tax breaks for their losses. Thus, owning a home in College Park was not an efficient method of building wealth. Their new home in majority-white Candler Park is accruing value, and one day, they will be able to sell it at a higher value, without paying taxes on up to a $500,000 gain.[22]
Even beyond the cities in this report, the devaluing of houses in predominately Black neighborhoods, or even at times, homes owned by Black people in predominately white neighborhoods, is a systemic problem.
Even beyond the cities in this report, the devaluing of houses in predominately Black neighborhoods, or even at times, homes owned by Black people in predominately white neighborhoods, is a systemic problem. In Jacksonville, Florida, Abena (who is Black) and Alex (who is White) Horton had their home appraised. They believe that the appraisal was too low. During the second appraisal, Alex was present instead of Abena and the couple removed all signs of Abena and their biracial son. The second appraisal yielded a 40% higher value than the appraisal where Abena was present. In Hartford, Connecticut, Stephen Richmond’s home value substantially increased after he removed family photos and had a white neighbor stand in for the second appraisal. Even Black celebrities fall victim to racial discrimination in housing. Comedian and actor D.L. Hughley purchased a home in southern California for $500,000. He renovated the home and added a pool. During an appraisal three years later, Hughley’s home was appraised for a similar price to what he originally purchased it for. The bank flagged it as a mistake and ordered another appraisal. The second appraisal came in $160,000 higher. Hughley went on to sell the home for $770,000.[23]
Unequal access to lending stymies efforts to build lasting wealth.
Racial economic inequality in the U.S. is primarily the result of unequal investments among communities. Estimates published by ProsperityNow showing the percentage of unbanked or underbanked populations in the United States for different racial and ethnic groups often highlight inequalities in the financial health of their neighborhoods. The percentage of Blacks (46%) who are unbanked or underbanked alone is over three times the percentage of whites (14%) who experience the same struggle. Thirty-two percent of Hispanics are also either un- or under- banked.

Bank accounts are useful tools for building emergency savings and banks themselves provide a connection to mainstream financial systems and programs that provide financial assistance and community investments. The combined 24% of Black and Hispanic populations who are completely unbanked are shut out of these basic tools though which to save and accrue earnings. Only 3% of whites are completely unbanked.
Fifty-four percent of minority populations are underbanked, meaning that while they may have access to bank accounts, these communities also experience a prevalence of alternative financial services like money orders, check cashers, and same day lenders, to manage finances.
Fifty-four percent of minority populations are underbanked, meaning that while they may have access to bank accounts, these communities also experience a prevalence of alternative financial services like money orders, check cashers, and same-day lenders, to manage finances.[24] These high-cost, low-quality financial services tend to trap borrowers in cycles of debt, increasing the financial vulnerability especially among communities of color and blocking efforts to build lasting wealth. Research by McKinsey & Co. reaches a similar conclusion that access to mainstream financial services is an important factor in accumulating savings that many Black Americans, unfortunately, lack—increasing access to basic banking services could save individual Black Americans up to $40,000 over their lifetime.[25]
Black people are more likely to encounter discriminatory lending practices that impact credit scores.
Unequal access to lending is not the only thing that hampers efforts by Blacks to establish financial security and accrue lasting wealth. The legacies of redlining, underinvestment, and a prevalence of alternative banking within these communities that make Black people more likely to encounter discriminatory lending practices also impact credit scores.
People pay attention to credit because loans and credit can provide opportunities to start businesses, increase human and physical capital, and build wealth. These all provide paths out of historical inequality in wealth accumulation. Unfortunately, Blacks must make extraordinary efforts to overcome the discrimination that is often hidden in financial policies or products that are supposed to be bias-free. While the 1974 Equal Credit Opportunity Act barred credit-score systems from using protected information, including race, the decades of discrimination in employment, lending policies, debt collection, and criminal prosecution that have left Black families vulnerable to financial insecurity also disadvantage credit scores.[26]
Without bank accounts, families often cannot generate the data that helps establish credit worthiness. As previously explained, the lack of banking institutions also leaves communities exposed to more predatory lending practices that encourage cyclical debt and impinge on credit worthiness.
Without bank accounts, families often cannot generate the data that helps establish creditworthiness. As previously explained, the lack of banking institutions also leaves communities exposed to more predatory lending practices that encourage cyclical debt and impinge on creditworthiness. While the ability to get a mortgage and pay it on time can have a positive impact on credit scoring, families without access to these financial vehicles can’t build robust credit histories. Unfortunately, the history of redlining that designated Black neighborhoods as too risky for mortgage lending is still evident in the structure of U.S. cities.[27]
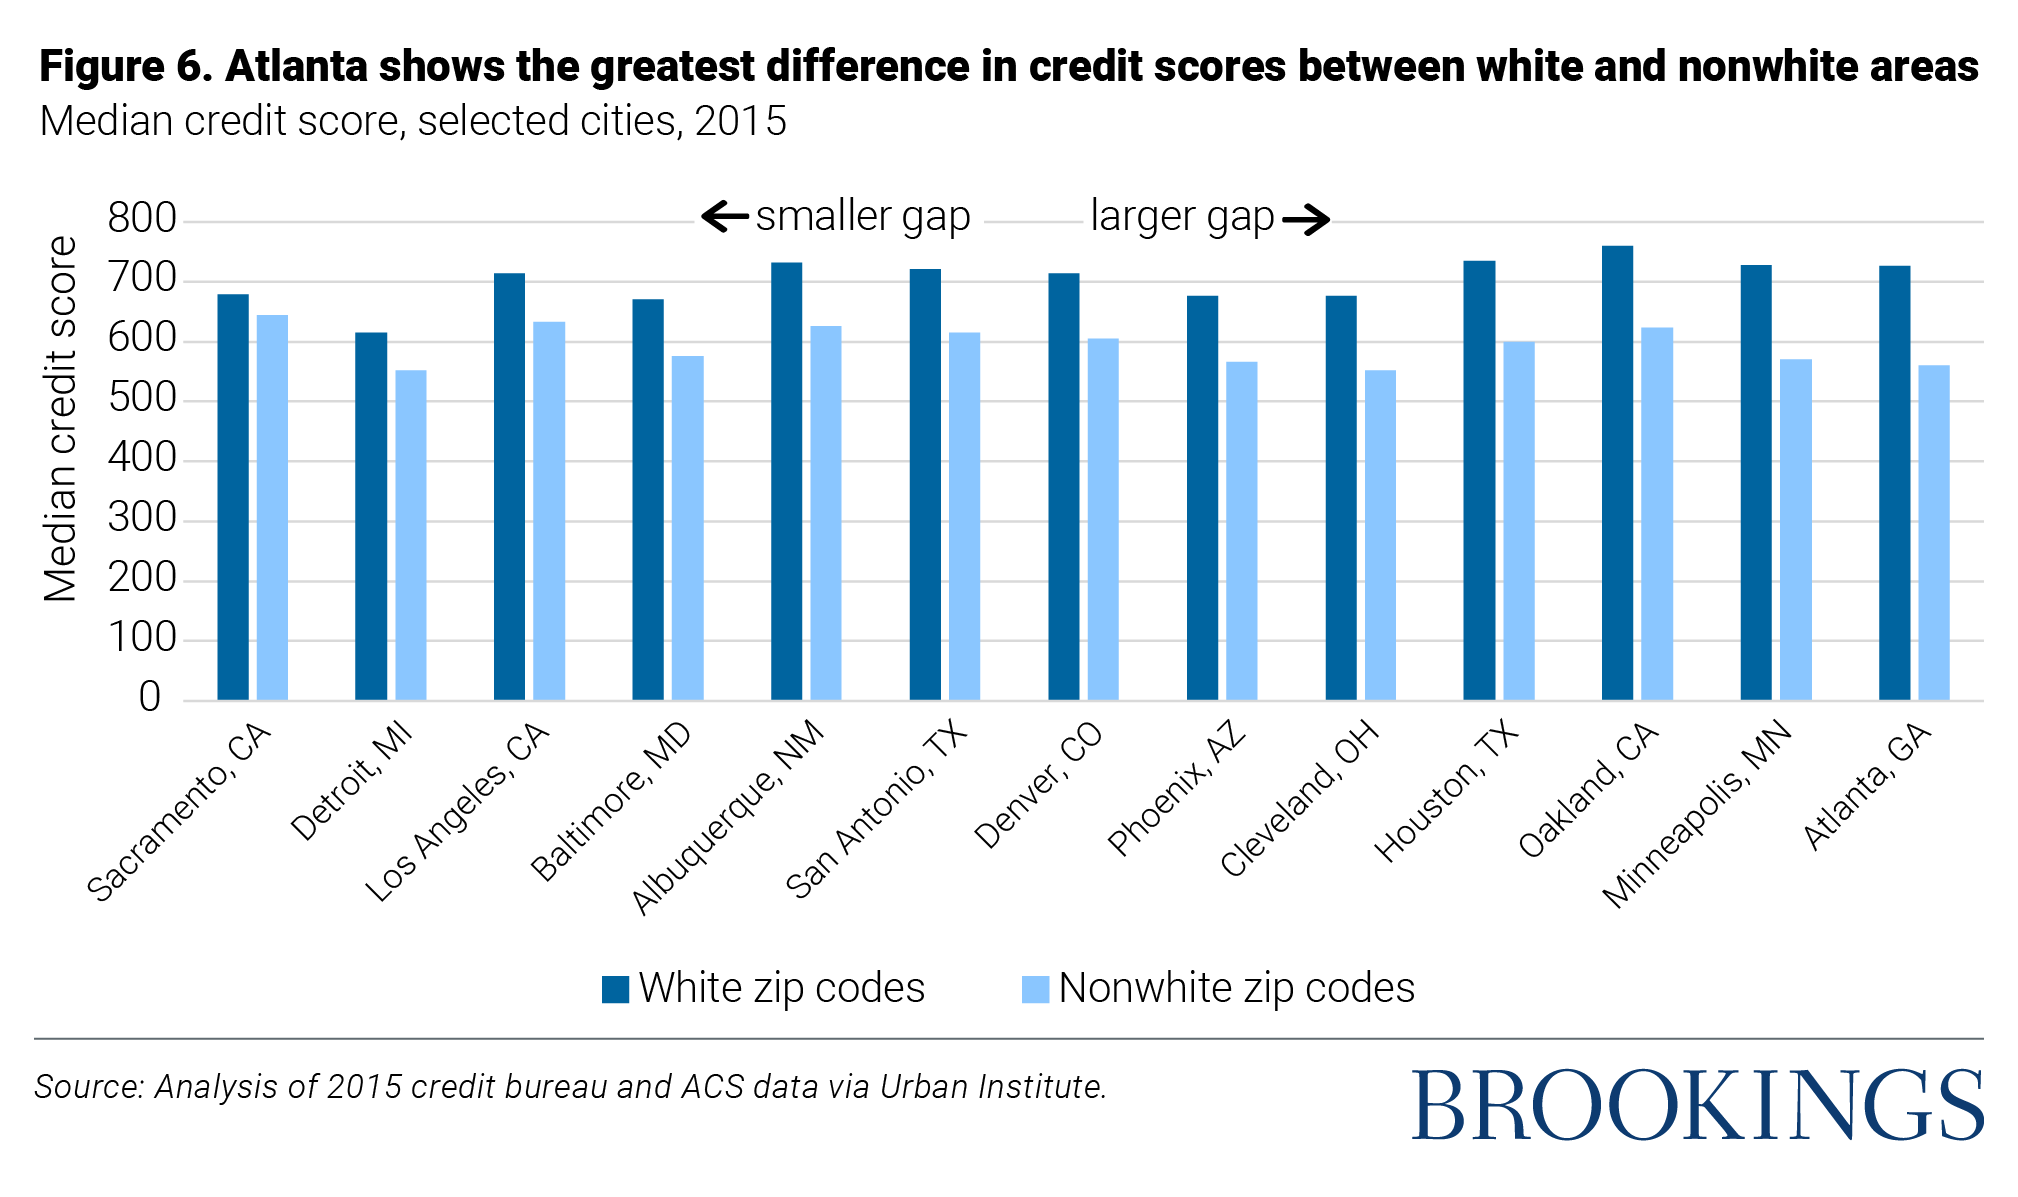
Places like Atlanta and Minneapolis highlight stark differences between the average credit scores in white and majority-minority neighborhoods. In these cities, the average credit score for predominantly white neighborhoods sits above 725. By contrast, the average credit score for non-white zip codes is 560 and 570 for Atlanta and Minneapolis, respectively. The demographic composition of these two cities is quite different—Atlanta is majority Black (50.1% Black) and Minneapolis is majority white (19.2% Black). However, the predominant spatial segregation along racial and ethnic lines bears markers of systemic discrimination. While these two cities have the largest gaps between credit scores and showcase the interaction of race and social status in geographic areas, nine of the cities examined have non-white communities at an over 100-point disadvantage in credit scores.
Another interesting city to examine is Detroit, which has the lowest credit scores for both white and majority minority communities across all of these cities. In comparison to other cities, Detroit has the largest percentage of Black residents in the sample at 78.3%. It has maintained a majority Black population since the 1980s. However, Detroit remains among the most segregated cities in the nation today, precisely because of redlining practices that largely blocked Black families from federally-backed mortgages and drove them into neighborhoods with sub-par amenities (e.g., health, education, banking, green spaces, safety) and sectioned “good” neighborhoods as being predominantly white.[28] This combination of subpar investments and difficulty in acquiring mortgages makes the funding for wealth-creating activities such as investing in education or entrepreneurial ventures less accessible.
In the short term, for those with low and unstable income, lack of credit can make it impossible to pay for an unexpected immediate expense. In the long term, without access to the credit needed to fund wealth-creating activities such as educational, workforce, and small business investments, communities of color continue to be harmed by the historical legacies of intentionally discriminatory financial practices.
Higher costs for education result in Black students taking on higher levels of debt.
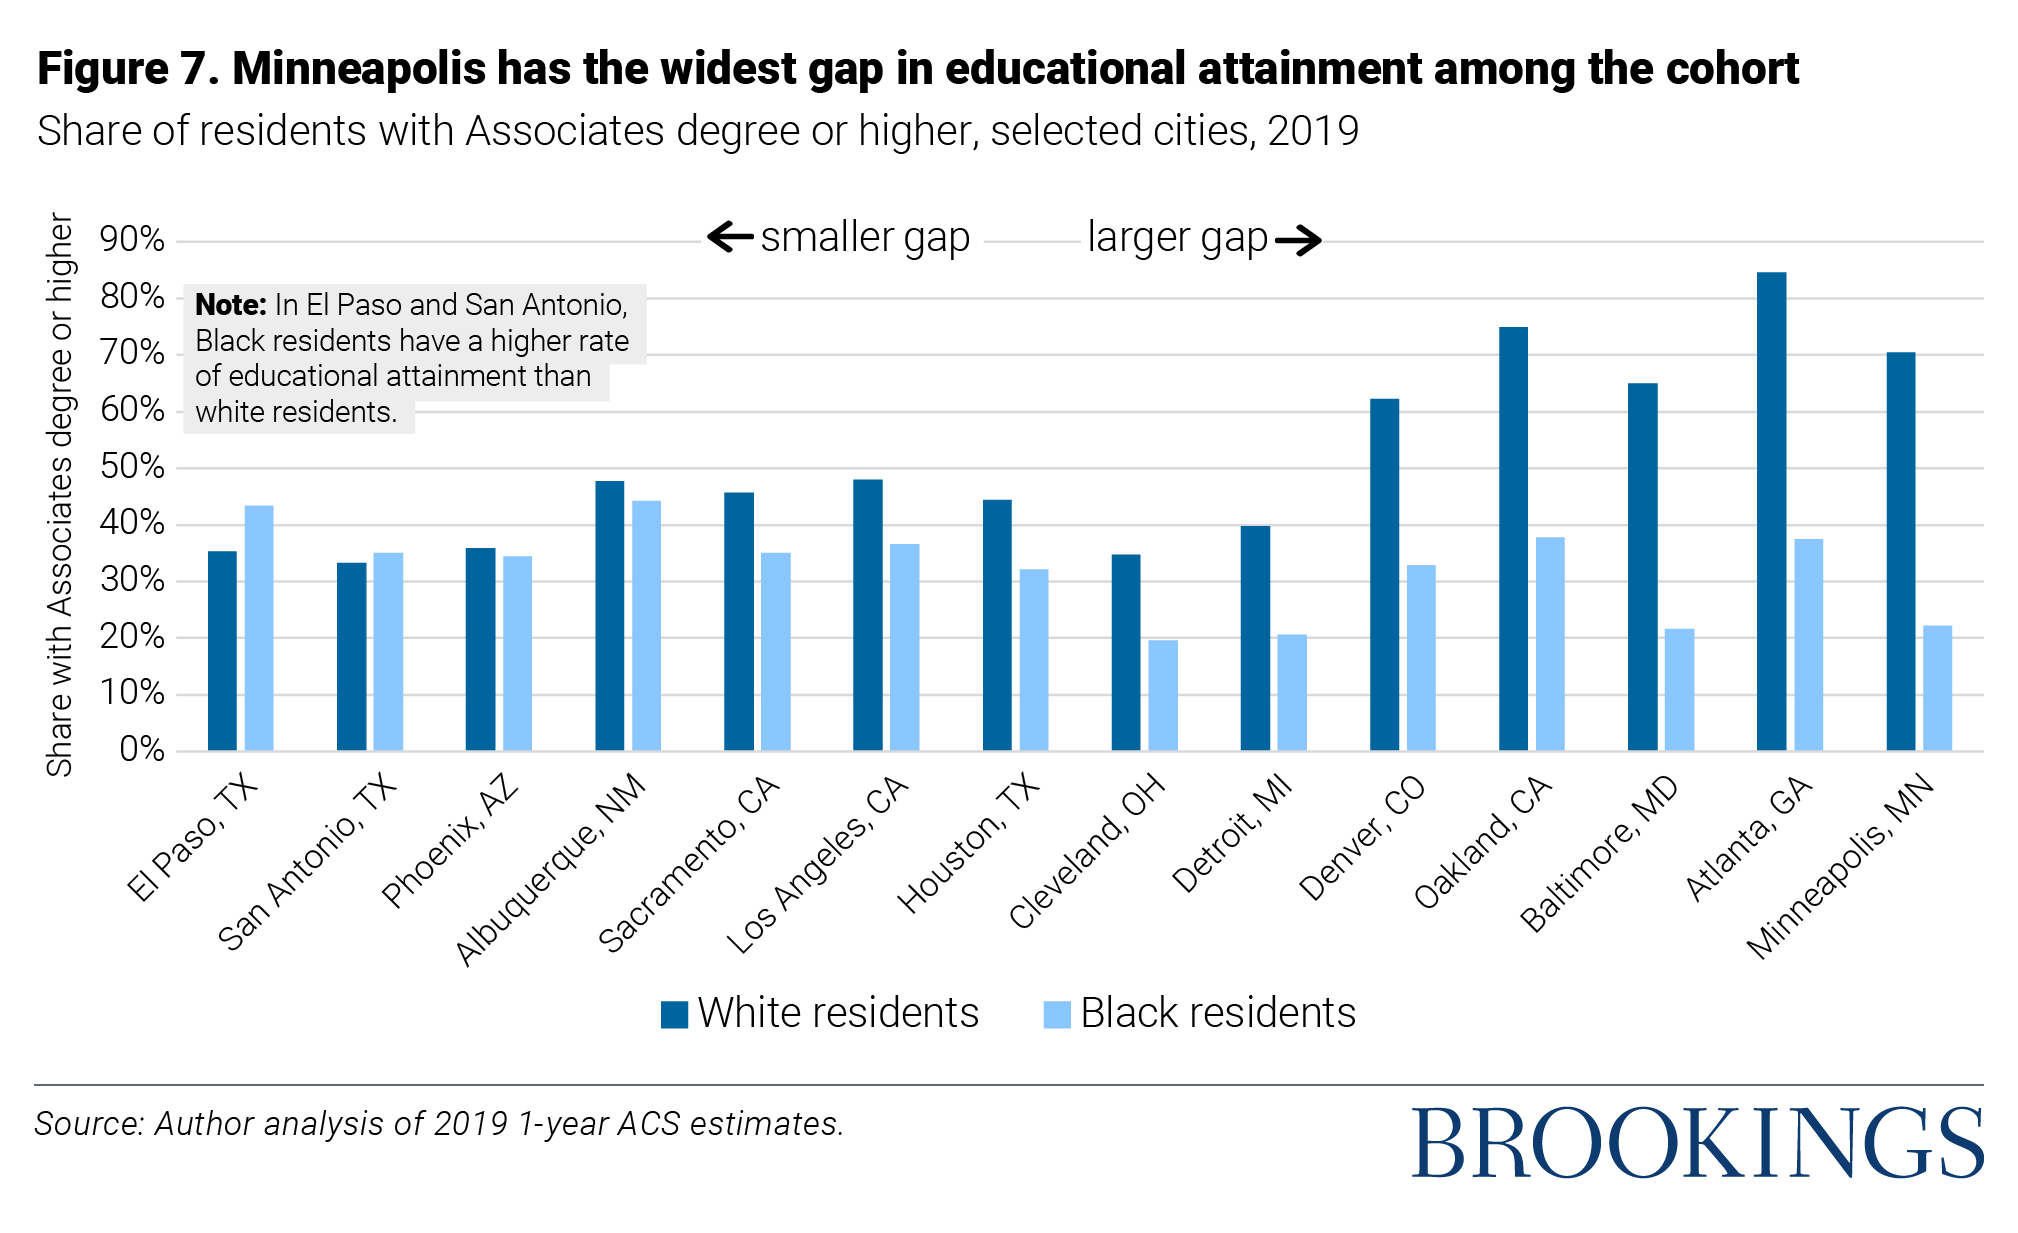
We used educational attainment data from the 2019 ACS estimates measuring the ratio of people with higher education degrees to the population age 25 or older to highlight differences in educational investments. More than 30% of Blacks in the cities examined have a higher education degree. Albuquerque, the city reporting the highest level of Black educational attainment, still only had 44% of Blacks over the age of 25 achieve an associate degree or higher.
Given the lack of mainstream banking in Black communities, it is no surprise that Blacks are more likely than whites to receive unsubsidized loans for education. Unsubsidized loans increase the amount of debt that Black college graduates have to take on in order to pursue higher education and make higher education less attainable.[29] Black college graduates also experience more difficulty in accumulating wealth than white college graduates since they accrue more student loan debt, and graduates from historically Black colleges are more likely to receive subprime loans with higher interest rates.[30]
There are two cities, San Antonio (with 35% Black and 33% white educational attainment) and El Paso (43% Black and 35% white), in which Blacks have higher levels of post-high school degrees than whites. When examining homeownership rates with educational attainment, it is clear that education does little to mute the racial gap in homeownership, even in cities where Blacks have higher educational attainment than whites.
When examining homeownership rates with educational attainment, it is clear that education does little to mute the racial gap in homeownership, even in cities where Blacks have higher educational attainment than whites.
Detroit and Cleveland have the lowest levels of Black educational attainment out of all cities (21% and 20%, respectively). Both cities are also in the bottom half of educational attainment across all racial groups. As mentioned, inequitable access to financial resources continues to exacerbate underinvestment in factors like education, which also contribute to the lack of ability to obtain wealth. Given that these cities have a majority minority population, it is no surprise that systemic barriers to wealth creation in the form of both financial and educational resources continue to manifest across the country in twenty-first century America. [31]
Policy recommendations
Closing the racial wealth gap will not be trivial. The gap has its roots in racist policies which trace back through the decades and centuries to even before the founding of the country. The vestiges of slavery, which prevented Black Americans from building any wealth for generations, as well as Jim Crow and New Deal-era policies, which sacrificed Black wealth-building opportunities to consolidate a white middle class, means the domino effects of this stolen possibility reach far and wide in American society. Therefore, solving this disparity will require a collection of policies and initiatives to tackle the most heinous examples of racial inequity that persist today, and which continue to rob Black America of the prosperity it is due. Because housing has been the primary mechanism by which Americans have built and passed along generational wealth in the last century, correcting injustices in housing is a prime area to begin attacking the harmful influence of systemic racism.
To bolster Black homeownership nationwide, we recommend a holistic approach to the home-buying process which will create a more equitable system before, during, and after securing a mortgage:
- Increase support for small dollar mortgage loan programs. It is a pervasive myth that homes of lower value are riskier investments for mortgages, but recent analysis from the Urban Institute shows that these buyers have comparable credit scores and their mortgages have similar loan-to-value ratios to more valuable properties.[32] As homes in Black neighborhoods are already devalued, this barrier to entry to homeownership disproportionately affects Black buyers, especially those who are first-time buyers.
- Reduce uneven costs of mortgages for Black homeowners. Homeownership while Black is expensive. Creating a rate-and-term refinancing option would help more households reduce monthly mortgage costs and lower the barrier to homeownership.
- Extend credit and down payment assistance to borrowers impacted by discriminatory housing and lending practices. Historical and ongoing policies such as redlining, restrictive covenants, “steering,” and more have extracted wealth from Black neighborhoods for generations. While it is not enough to simply extend credit based on redlining maps drawn in the New Deal Era, past injustices must be redressed by helping to develop areas left behind by racist policies.
- Adopt credit scoring practices with less discriminatory impacts. Current metrics of credit scoring do not account for regular payments from rent and utilities, instead they prioritize loan and credit card payments. Expanding notions of credit-building can dispel the myth that Black homeowners are risky investments.
- Increase diversity in the appraisal profession. Nearly 9 in 10 property appraisers are white, while 2% are Black, according to Urban Institute analysis of 2019 Census data.[33] With the numerous instances of appraiser bias making headlines on a consistent basis, better representation in the profession which holds sway over much of the valuation process could go a long way to mitigating the effects of societal bias against Black neighborhoods.
- Continue stimulus and relief efforts for homeowners and buyers in the wake of the COVID-19 pandemic. Black Americans are joining the ranks of homeowners at a steady rate, but the disparate impacts of the pandemic and associated recession mean that preexisting Black homeowners faced disproportionate difficulty with mortgage payments. Foreclosure moratoriums allowed many to hold onto their homes, but now they face repayment of deferred mortgages, and a bifurcated economy has not yet returned Black employment to pre-pandemic levels.
Through this report, we have provided a comprehensive overview of the role of segregation, discrimination, and racism in the housing market, as well as policy opportunities and recommendations to reduce these racial disparities. Implementing these evidence-based solutions will improve opportunities for potential Black homebuyers and reduce the racial wealth gap.
Acknowledgements
The Brookings Institution is a nonprofit organization devoted to independent research and policy solutions. Its mission is to conduct high-quality, independent research and, based on that research, to provide innovative, practical recommendations for policymakers and the public. The conclusions and recommendations of any Brookings publication are solely those of its authors, and do not reflect the views of the Institution, its management, or its other scholars. Support for this publication was generously provided by The Change Company, LLC. Brookings recognizes that the value it provides is in its absolute commitment to quality, independence, and impact. Activities supported by its donors reflect this commitment.
References
[1] “Quarterly Residential Vacancies and Homeownership, First Quarter 2021.” U.S. Census Bureau, April 27, 2021. https://www.census.gov/housing/hvs/files/currenthvspress.pdf.
[2] Perry, Andre. 2020. Know Your Price: Valuing Black Lives and Property in America’s Black Cities. Brookings Press: Washington DC.
[3] Dettling, Lisa J., Joanne W. Hsu, Lindsay Jacobs, Kevin B. Moore, and Jeffrey P. Thompson. Recent Trends in Wealth-Holding by Race and Ethnicity: Evidence from the Survey of Consumer Finances. The Federal Reserve, September 27, 2017. https://www.federalreserve.gov/econres/notes/feds-notes/recent-trends-in-wealth-holding-by-race-and-ethnicity-evidence-from-the-survey-of-consumer-finances-20170927.htm.
[4] Edbuild, “$23 Billion Report.” 2019. Accessed on 28 June 2021. https://edbuild.org/content/23-billion.
[5] Ray, Rashawn, and Andre M. Perry. “Why We Need Reparations for Black Americans.” The Brookings Institution, March 4, 2021. http://www.brookings.edu/policy2020/bigideas/why-we-need-reparations-for-black-americans/.
[6] McManus, Michael. “Minority Business Ownership: Data from the 2012 Survey of Business Owners.” U.S. Small Business Administration Office of Advocacy, September 14, 2016. https://cdn.advocacy.sba.gov/wp-content/uploads/2016/09/07141514/Minority-Owned-Businesses-in-the-US.pdf.
[7] Grotto, Jason, Zachary R. Mider, and Cedric Sam. “White America Got a Head Start on Small-Business Virus Relief.” Bloomberg, June 30, 2020. https://www.bloomberg.com/graphics/2020-ppp-racial-disparity/.
[8] Fairlie, Robert. “The Impact of Covid-19 on Small Business Owners: Evidence of Early-Stage Losses from the April 2020 Current Population Survey.” Stanford Institute for Economic Policy Research, May 2020. https://siepr.stanford.edu/research/publications/impact-covid-19-small-business-owners-evidence-early-stage-losses-april-2020.
[9] Ray, Rashawn, Jane Fran Morgan, Lydia Wileden, Samantha Elizondo, and Destiny Wiley-Yancy, “Examining and Addressing COVID-19 Racial Disparities in Detroit.” The Brookings Institution, March 2, 2021. http://www.brookings.edu/research/examining-and-addressing-covid-19-racial-disparities-in-detroit/.
[10] U.S. Census Bureau. American Community Survey 2019 (5-Year Estimates). Retrieved from Social Explorer.
[11] Massey, Douglas, and Nancy Denton. American Apartheid: Segregation and the Making of the Underclass. Cambridge, MA: Harvard University Press, 1993.
[12] Saporito, Salvatore, and Daniel Casey. “Are There Relationships Among Racial Segregation, Economic Isolation, and Proximity to Green Space?” Human Ecology Review 21, no. 2 (2015): 113-32. http://www.jstor.org/stable/24875135.
[13] Perry, Andre M. “A Revolution of Values for Black American Families.” The Brookings Institution, May 22, 2020. http://www.brookings.edu/blog/the-avenue/2020/05/22/a-revolution-of-values-for-black-american-families/.
[14] Analysis of 2019 5-Year ACS Estimates.
[15] McCargo, Alanna, and Jung Hyun Choi. “Closing the Gaps: Building Black Wealth through Homeownership.” Urban Institute, December 9, 2020. https://www.urban.org/research/publication/closing-gaps-building-black-wealth-through-homeownership.
[16] Dettling, Lisa J, Joanne W Hsu, Lindsay Jacobs, Kevin B Moore, and Jeffrey P Thompson. “Recent Trends in Wealth-Holding by Race and Ethnicity: Evidence from the Survey of Consumer Finances.” Federal Reserve, September 27, 2017. https://www.federalreserve.gov/econres/notes/feds-notes/recent-trends-in-wealth-holding-by-race-and-ethnicity-evidence-from-the-survey-of-consumer-finances-20170927.htm.
[17] Henry-Nickie, Makada, Tim Lucas, Radha Seshagiri, and Samantha Elizondo. “Low to Moderate-Income Families Are Losing Ground: How to Save Their Homeownership Dreams.” The Brookings Institution, June 24, 2021. http://www.brookings.edu/blog/how-we-rise/2021/06/24/working-class-families-are-losing-ground-how-to-save-their-homeownership-dreams/.
[18] Analysis of 2019 5-Year ACS Estimates.
[19] Sheridan, Jill. “A Black Woman Says She Had To Hide Her Race To Get A Fair Home Appraisal.” NPR, May 21, 2021. https://www.npr.org/2021/05/21/998536881/a-black-woman-says-she-had-to-hide-her-race-to-get-a-fair-home-appraisal.
[20] Haythorn, Russell. “An Unconscious Bias? Biracial Denver Couple Says They Faced Discrimination on Home Appraisal.” The Denver Channel, November 19, 2020. https://www.thedenverchannel.com/news/local-news/an-unconscious-bias-biracial-denver-couple-says-they-faced-discrimination-on-home-appraisal.
[21] Perry, Andre M., Jonathan Rothwell, and David Harshbarger. “The Devaluation of Assets in Black Neighborhoods.” The Brookings Institution, February 17, 2021. http://www.brookings.edu/research/devaluation-of-assets-in-black-neighborhoods/.
[22] Brown, Dorothy A. “Your Home’s Value Is Based on Racism.” The New York Times. The New York Times, March 20, 2021. https://www.nytimes.com/2021/03/20/opinion/home-value-race-taxes.html.
[23] Kamin, Debra. 2020. ”Black Homeowners Face Discrimination in Appraisals.” The New York Times, August 27, 2021. https://www.nytimes.com/2020/08/25/realestate/blacks-minorities-appraisals-discrimination.html.
[24] Williams, Claire. “’It’s What We Call Reverse Redlining’: Measuring the Proximity of Payday Lenders, Pawn Shops to Black Adults.” Morning Consult, July 24, 2020. https://morningconsult.com/2020/07/23/black-consumers-payday-loan-banking-services/.
[25] Noel, Nick, Duwain Pinder, Shelley Stewart Ill, and Jason Wright. “The Economic Impact of Closing the Racial Wealth Gap.” McKinsey & Company, August 2019. https://www.mckinsey.com/~/media/mckinsey/industries/public%20and%20social%20sector/our%20insights/the%20economic%20impact%20of%20closing%20the%20racial%20wealth%20gap/the-economic-impact-of-closing-the-racial-wealth-gap-final.pdf.
[26] Klein, Aaron. “Credit Denial in the Age of AI.” The Brookings Institution, October 25, 2019. http://www.brookings.edu/research/credit-denial-in-the-age-of-ai.
[27] Mitchell, Bruce, and Juan Franco. “HOLC ‘Redlining’ Maps: The Persistent Structure of Segregation and Economic Inequality.” National Community Reinvestment Coalition, December 18, 2018. https://ncrc.org/holc/.
[28] Ray, Rashawn. “Why are Blacks Dying at Higher Rates of COVID-19?” The Brookings Institution. April 56, 2020. http://www.brookings.edu/blog/fixgov/2020/04/09/why-are-blacks-dying-at-higher-rates-from-covid-19/.
[29] Weller, C., & Roberts, L. (2021, March 19). Eliminating the Black-White Wealth Gap Is a Generational Challenge. Center for American Progress. March 19, 2021. Accessed July 13, 2021. https://www.americanprogress.org/issues/economy/reports/2021/03/19/497377/eliminating-black-white-wealth-gap-generational-challenge/
[30] Ray, Rashawn, and Perry, Andre. “Why we need reparations for Black Americans.” The Brookings Institution. March 4, 2021. http://www.brookings.edu/research/black-white-disparity-in-student-loan-debt-more-than-triples-after-graduation/.
[31] Analysis of 2019 5-Year ACS Estimates.
[32] McCargo, Alanna, Bing Bai, and Sarah Strochak. “Small-Dollar Mortgages: A Loan Performance Analysis.” Urban Institute, March 6, 2019. https://www.urban.org/research/publication/small-dollar-mortgages-loan-performance-analysis.
[33] Neal, Michael, and Peter J. Mattingly. “Increasing Diversity in the Appraisal Profession Combined with Short-Term Solutions Can Help Address Valuation Bias for Homeowners of Color.” Urban Institute, July 1, 2021. https://www.urban.org/urban-wire/increasing-diversity-appraisal-profession-combined-short-term-solutions-can-help-address-valuation-bias-homeowners-color.